On the backdrop of lackluster retail data, another bloodbath week for the SPY saw it decline as far as 20% for the year from its January all-time high.
The equity markets had a late Friday reversal after dipping into bear territory, giving investors a silver lining on the horizon. Would the new week bring the silver lining closer, or would it prove a mirage?
Monday morning saw prices open at $392.86, a 0.9% gap up compared to Monday’s closing price of $389.54, a phenomenon not seen in Monday market opening since early April.
Was this a sign of SPY fortunes turning for the better, or was it a false positive?
Bullish investors would capitalize on this signal, pushing prices to the $397.45 level. What followed was a tussle that would see markets go sideways for the better part of Monday afternoon trading. Tuesday would open with the bears taking on the bulls by the horns to push prices to last week’s support level of $387.58. However, the bullish momentum created on Monday would help bullish sentiments arrest the price slide and launch another bearish rally to see the SPY trade in the $405.29 level, a significant pivotal level for the month.
So, what moved the markets in favor of the bulls for the week?
The most significant contributors to the dovish sentiments provided a tailwind for the bullish rally. Despite most wall street predicting a 75-basis point rate hike for June and July to curb the rising inflation, the minutes confirmed that the FED would continue with the 50-basis points employed in May for the two months in question.
This decision is enormous due to the current economic data showing that price pressures are getting better. Couple this with parts of China easing Covid-19 lockdowns, dollar value leveling out, and a decline in the bond yields. The economy is back on an uptrend resulting in the SPY recently finishing one of its best weeks with an encouraging +3.08% change.
Top gainers of the current week
Energy sector
The energy sector continues to get investment inflows as the Ukrainian war makes it a scarce commodity. For the week, it closed with a whopping +6.32%.
Financials sector
The newfound bullish sentiment buoyed the financial services sector, coupled with lower than expected rate hikes for June and July to propel this sector to a +6.15% weekly change.
Consumer Discretionary sector
Reducing inflationary pressure means more disposable income, which pushed inflows into the consumer discretionary sector to have it close with an encouraging +5.58% weekly change.
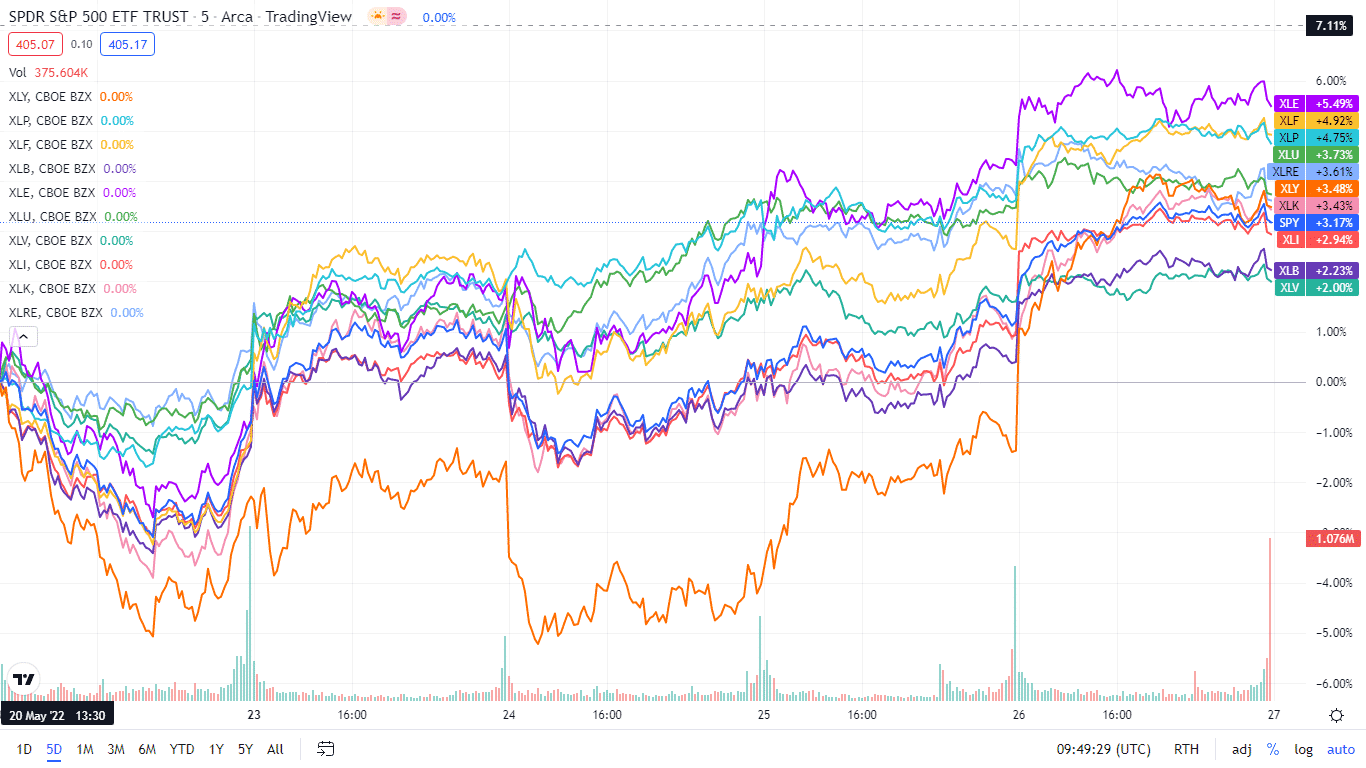
Below is a performance chart of the SP 500 over the week and its component sectors.

The S&P 500 individual sectors’ weekly chart
In an excellent week for the SPY, since its all-time high in January, the S&P 500 ended the week in the green. Below is the respective sector breakdown, using their corresponding ETFs.
The S&P 500 individual sector, weekly performance breakdown |
|||
| 1. | Energy | XLE | +6.32% with the accompanying energy select sector ETF |
| 2. | Financial Services | XLF | +6.15% with the accompanying financial select sector ETF |
| 3. | Consumer Discretionary | XLY | +5.58% with the accompanying consumer discretionary select sector ETF |
| 4. | Consumer Staples | XLP | +5.01% with the accompanying consumer staples select sector ETF |
| 5. | Information Technology | XLK | +4.48% with the accompanying information technology select sector ETF |
| 6. | Industrial | XLI | +4.20% with the accompanying industrial select sector ETF |
| 7. | Materials | XLB | +3.56% with the accompanying materials select sector ETF |
| 8. | Utilities | XLU | +3.47% with the accompanying utilities select sector ETF |
| 9. | Real Estate | XLRE | +2.91% with the accompanying real estate select sector ETF |
| 10. | Healthcare | XLV | +1.46% with the accompanying healthcare select sector ETF |
| 11. | Communication Services | XLC | +0.94% with the accompanying communication services select sector ETF |


Comments