
After a second straight week in the red that saw the SPY erode its best gains since 2020, investors were hoping for some easter eggs from the markets.
Would the Q1 earnings report starting with banks buoy the equity markets, or would they show a slowing economy sparking massive sell-offs?
What was the cause of this sideways movement? After a second straight week in the red, bearish SPY investors were confident about where the markets were headed. This confidence resulted in an opening price of $444.12, a 0.8% price gap-down. This slide-in prices would be experienced for the subsequent two days, leaving the SPY flirting with the $436.77 pivotal level established in early April.
However, this level proved a formidable support level, and bullish investors used this as a launchpad to correct the price slide and test the $444.79 resistance level. However, this resistance level also proved its mettle to repel the bullish push and have the SPY prices at the close of Thursday for the Easter weekend in the $437.86 region.
2022 Q1 earnings report kicked off with banks reporting on their numbers. With a tendency to outperform the markets, the bank earnings report is an investor indicator of the economy’s health. Adverse earnings reports by the likes of JPMorgan indicate the slowing down economic growth and, coupled with the inverted yield curve, a reason to reinforce investor jitters about a looming recession.
Due to the Ukraine-Russia war, there are persistent supply chain bottlenecks and the remnant effect of the coronavirus pandemic, meaning earnings for the other sectors can also be expected to show a slowing down the economy. These results increased bearish sentiment for the week, which saw the SPY end the week lower than last with a -2.30% change.
Top gainers of the current week
Materials Sector
Despite the rising inflation and price of commodities, the PPI recorded yet another increase to set a stage for the material sector to experience some inflows and close the week with a +0.69% change.
Industrial Sector
Another segment to benefit from inflows due to the rising producer price index was the industrial sector, and the result was a +0.43% weekly change.
Energy Sector
The energy sector seems to have shaken the effects of Russian energy sanctions to close the week in the green with a +0.32% change.
Losers of the current week
Healthcare sector at — 2.93%
Communication Services sector at — 3.01%
Information Technology sector at — 3.82%
With every economic indicator pointing to a slowed-down economy and the Q1 earnings streaming in affirming this sentiment, the segments experiencing the worst outflows were as above. Below is a performance chart of the SP 500 over the week and its component sectors.
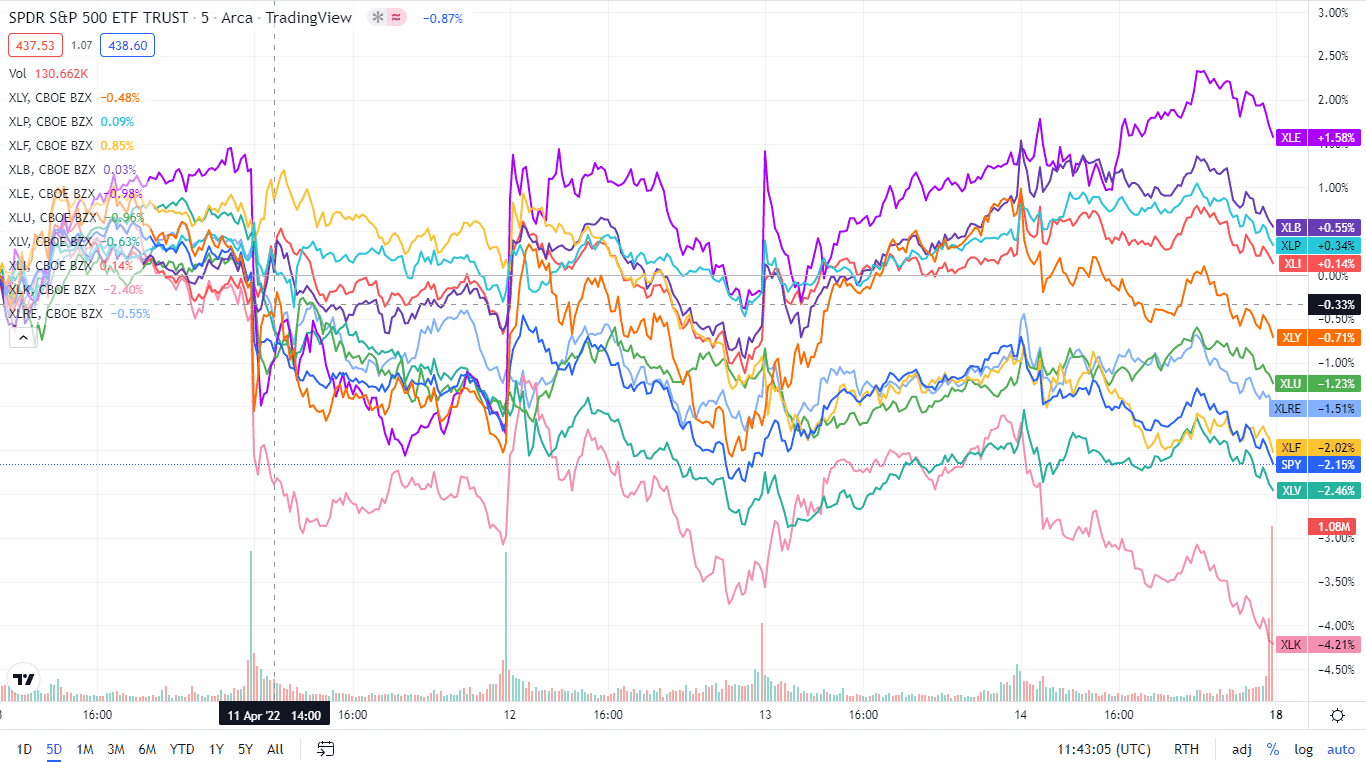
The S&P 500 individual sectors’ weekly chart
The following breakdown shows how the S&P 500 ended the week using its corresponding ETFs. The SPY was largely sideways with a bearish inclination with the majority of the sectors in the red.
The S&P 500 individual sector, weekly performance breakdown |
|||
| 1. | Materials | XLB | +0.69% with the accompanying materials select sector ETF |
| 2. | Industrial | XLI | +0.43% with the accompanying industrial select sector ETF |
| 3. | Energy | XLE | +0.32% with the accompanying energy select sector ETF |
| 4. | Consumer Staples | XLP | +0.15% with the accompanying consumer staples select sector ETF |
| 5. | Consumer Discretionary | XLY | -0.81% with the accompanying consumer discretionary select sector ETF |
| 6. | Utilities | XLU | -1.15% with the accompanying utilities select sector ETF |
| 7. | Real Estate | XLRE | -1.86% with the accompanying real estate select sector ETF |
| 8. | Financial Services | XLF | -2.65% with the accompanying financial select sector ETF |
| 9. | Healthcare | XLV | -2.93% with the accompanying healthcare select sector ETF |
| 10. | Communication Services | XLC | -3.01% with the accompanying communication services select sector ETF |
| 11. | Information Technology | XLK | -3.82% with the accompanying information technology select sector ETF |


Comments