
Last week saw a shortened week that had the SPY largely sideways before finishing the week in the red.
Would the continued streaming-in of the Q1 earnings report be the catalyst to get the SPY out of its current rut, or would the status quo remain?
An opening price of $436.87 continued where the prices had left off before breaking for easter at $437.84. coincidentally, this was also a significant pivotal level since the turn of the year, so it was no surprise when prices went sideways for the next two days as they tested the support this level would offer. Bulls would get the better of the bears on this stalemate and push prices on a bullish price rally that would see another important pivotal level on the opposite end tested, $447.2, after a 0.9% gap up on Thursday.
Prices would push to $448.53, but the break on this resistance level proved to be a false breakout, further consolidating the importance of this resistance level. Bears would take the bulls by the horns and drive prices down to close the week’s trading at $438.03.
Inflation has been on our lips for quite a long time now, but if used car prices data for last month is to be believed, one of the primary inflation indicators, Powell and Co’s strategies might be effective. The data shows that used car prices did not only slow their exponential climb but dropped. This might have been the news that saw the bulls take charge of the markets for the better part of the week. However, Powell’s statements that a double-sized rate hike is on the table for May contradicted the data showing he was right on inflation being transitory. Despite March’s leading economic indicators agreeing with the used car sales that the economy is still growing while inflation is reducing, pending double-sized rate hikes provided an updraft for the bears to push the SPY prices to yet another week in the red -1.24%.
Top gainers of the current week
Real Estate sector
The rising inflation and price of commodities continue to push investors to more inflation-hedged assets. The continued cautiousness had the real estate sector benefitting from ending the week with a +3.07%.
Consumer Staples sector
In a rate hiking and inflation rising environment, coupled with increasing commodity prices, has the inelastic demand of the consumer staples sector as a haven investment resulted in a +2.01% weekly change.
Financial Services sector
The financial services sector enjoyed a stellar week to end in the green, +1.07% change on the backdrop of Powell’s statement on double figures rate hikes.
Losers of the current week
Utilities Sector at — 0.69%
Energy Sector at — 2.19%
Communication services sector at — 4.59%
Despite a week filled with positives due to March leading indicators being more positive than expected, the three sectors that dragged the SPY to the dogs were as above.
Below is a performance chart of the SP 500 over the week and its component sectors.
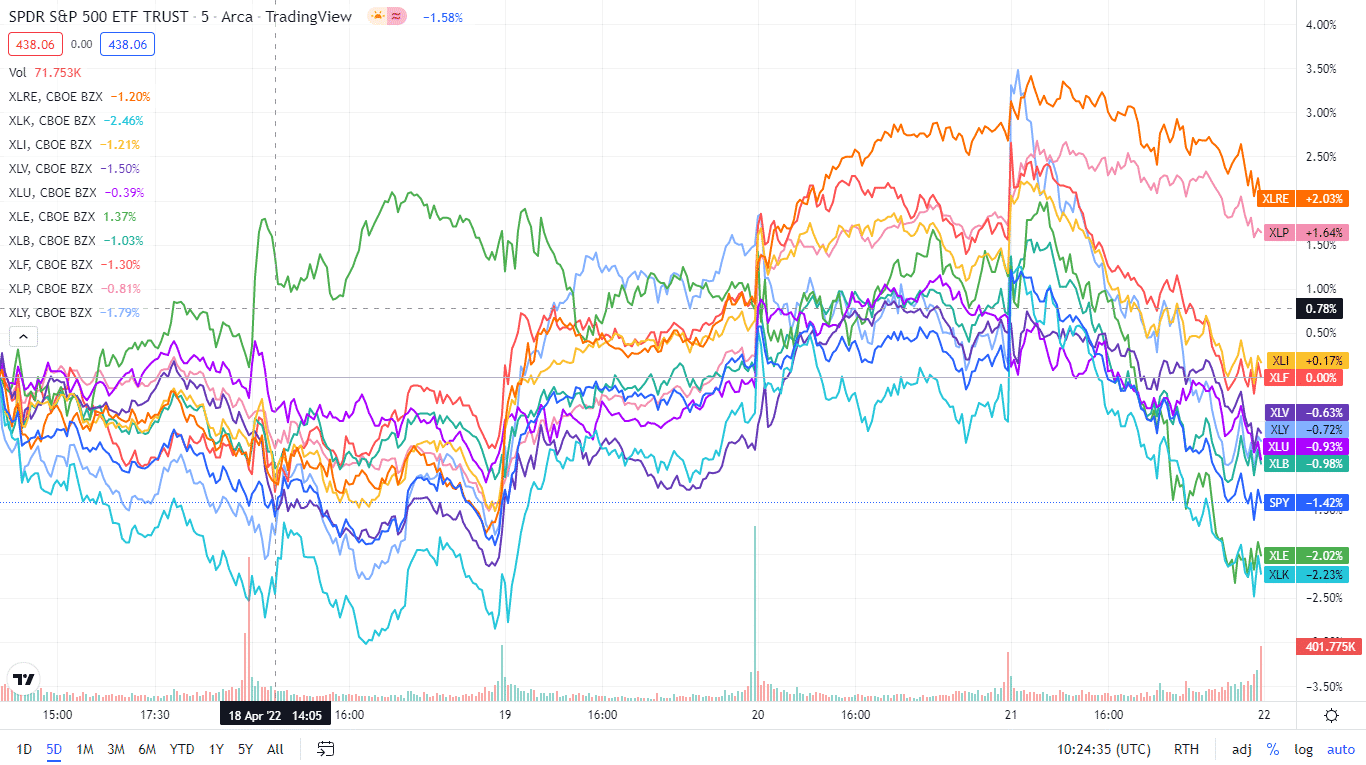
The S&P 500 individual sectors’ weekly chart
The following breakdown shows how the S&P 500 ended the week using its corresponding ETFs. Despite most segments finishing the week in the green, the SPY closed the week in the red.
The S&P 500 individual sector, weekly performance breakdown |
|||
| 1. | Real Estate | XLRE | +3.07% with the accompanying real estate select sector ETF |
| 2. | Consumer Staples | XLP | +2.01% with the accompanying consumer staples select sector ETF |
| 3. | Financial Services | XLF | +1.07% with the accompanying financial select sector ETF |
| 4. | Industrial | XLI | +0.95% with the accompanying industrial select sector ETF |
| 5. | Consumer Discretionary | XLY | +0.6% with the accompanying consumer discretionary select sector ETF |
| 6. | Information Technology | XLK | +0.27% with the accompanying information technology select sector ETF |
| 7. | Healthcare | XLV | +0.02% with the accompanying healthcare select sector ETF |
| 8. | Materials | XLB | +0.00% with the accompanying materials select sector ETF |
| 9. | Utilities | XLU | -0.69% with the accompanying utilities select sector ETF |
| 10. | Energy | XLE | -2.19% with the accompanying energy select sector ETF |
| 11. | Communication Services | XLC | -4.59% with the accompanying communication services select sector ETF |


Comments