
April headwinds included but were not limited to; unprecedented inflation levels, unending Ukraine war, tightening monetary policies, China border closure due to Covid-19, and rising interest rates. The result was the worst trading month for the equity markets, resulting in SPY’s 8.8 % price slide, the worst since the start of the coronavirus pandemic.
Would it be new beginnings for the SPY in May, or was the price bottom still to be reached?
An opening price of $412.00 was right where the markets ended the horrendous April performance. Both bears and bulls were apprehensive, resulting in a sideways market till bears danced around the bulls and pulled prices to the $406.5 level.
This level proved to be a significant support level, with the bulls taking advantage and pushing prices to the previous week’s support level, which now turned to a pivotal level of $418.52. Prices would be trapped in a sideways channel between the $418.52 level and the $413.86 level, awaiting Fed’s actual announcement on rate hikes.
A half percentage rate hike would be confirmed by Powell on Wednesday, resulting in investor cheers and markets rallying to drive the SPY to the$429.14 price level. However, this jubilation would be short-lived as this rate hike on economic growth would increase investor fears, and the subsequent market volatility heighten.
Coupled with the continuing Ukraine war, rising inflation, and rising oil prices, the SPY experienced its worst 1-day bearish run to close the day with a 3.6% nosedive.
Top gainers of the current week’s
Energy sector
The OPEC meeting on Thursday confirmed Europe’s decision to sanction Russian oil in an attempt to end the Ukraine-Russia war. The resulting jitters about supply shortages pushed oil prices higher to propel the energy sector to a +7.50% weekly change.
Communication services sector
In a week marred by negative news on economic development, the sector would receive significant inflows to end the week in the green, +2.43%.
Financial Services sector
Lower than expected earnings have organizations and individuals looking for cash to ensure survival and a drive to ensure earnings in the second quarter. It resulted in inflows into this sector to have it close the week with a +1.30% change.
Losers of the current week
are the Consumer Staples Sector at — 1.12%
Consumer Discretionary Sector at — 1.23%
Real Estate Sector at — 2.10%.
In a week that investors tried to rally the markets into a bullish run and failed, investors moved away from defensive sectors resulting in the above three losing significant outflows and posting the worst weekly change.
Below is a performance chart of the SP 500 over the week and its component sectors.
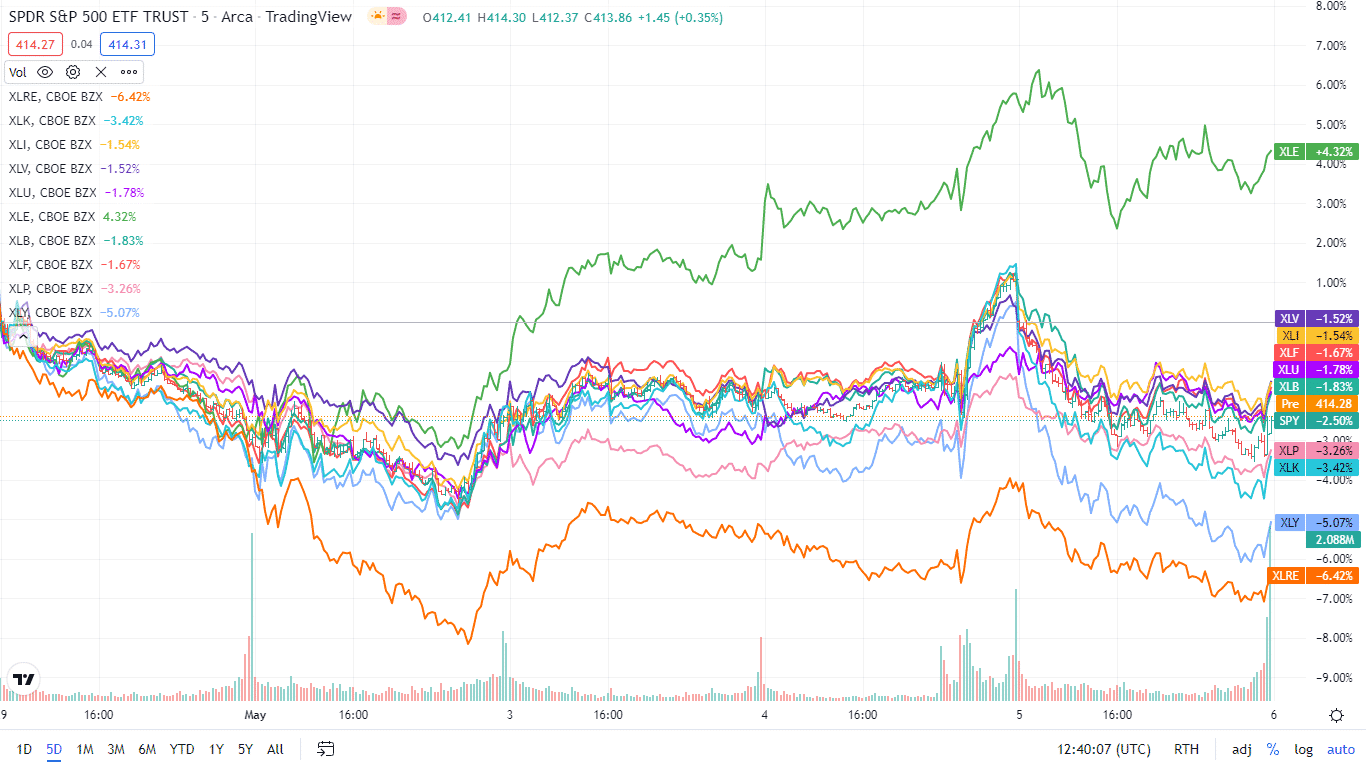
The S&P 500 individual sectors’ weekly chart
The following breakdown shows how the S&P 500 ended the week, using their corresponding ETFs. It was another week of ups and downs, exhibiting almost an even distribution of sectors in both the red and green.
The S&P 500 individual sector, weekly performance breakdown |
|||
| 1. | Energy | XLE | +7.50% with the accompanying energy select sector ETF |
| 2. | Communication Services | XLC | +2.43% with the accompanying communication services select sector ETF |
| 3. | Financial Services | XLF | +1.30% with the accompanying financial select sector ETF |
| 4. | Industrial | XLI | +1.00% with the accompanying industrial select sector ETF |
| 5. | Materials | XLB | +0.82% with the accompanying materials select sector ETF |
| 6. | Utilities | XLU | +0.43% with the accompanying utilities select sector ETF |
| 7. | Information Technology | XLK | +0.13% with the accompanying information technology select sector ETF |
| 8. | Healthcare | XLV | -0.15% with the accompanying healthcare select sector ETF |
| 9. | Consumer Staples | XLP | -1.3% with the accompanying consumer staples select sector ETF |
| 10. | Consumer Discretionary | XLY | -2.10% with the accompanying consumer discretionary select sector ETF |
| 11. | Real Estate | XLRE | -2.78% with the accompanying real estate select sector ETF |


Comments