
Consumer and investor purchasing power continues to erode against rising inflation and prices. The result was the worst weekly price decline for the SPY since 2011.
Would the SPY continue this upward trend after stocks bounced higher to close a chaotic week with some rebound, or would it experience another week of a blood bath?
Monday morning saw prices open at $400, more or less the same level that the markets had closed on Friday, $401.89. This opening was good news for bullish investors, having experienced market gap downs following a torrid week. Bullish sentiments would push prices up to the $402.8 level to form a temporary sideways channel with the $397.82 price level. A 1.6% gap up would break prices from this sideways market, with the bulls pushing prices to $408.24. This proved a formidable resistance level giving bears the foothold they needed to push prices downwards. There would be no respite for bulls as prices plummeted to trade at the $389.48 price level on Friday.
So, what moved the markets in such an erratic manner? Investors worry about the Fed’s ability to overturn the now rampant inflation levels, the highest in the last four decades, without its aggressiveness triggering a recession. The geopolitical risks resulting in supply chain bottlenecks and macro-economic factors due to the Ukraine war and the closure of China due to the coronavirus also continue to weigh down the equity markets.
Couple all these factors to earnings from defensive sectors, primarily retail-related stocks, coming in much lower than expected, and the SPY continues to be on the ropes for a beat down. Is it bear season with all of these factors? Equities are oversold mainly, and with more people buying the dip, this might be the beginning of a significant bear market. For the week, the SPY slid -by 1.87% for the week.
Top gainers of the current week
Energy sector
The energy sector recovered from the previous week’s doldrums to take advantage of continued oil deficits and close the week in the green, +0.65%.
Utilities sector
With the retail sector’s low earnings resulting in outflows in the consumer discretionary and consumer staples segments, the other defensive sectors took center stage. The utility sector led the pack with a +0.09% weekly change.
Materials sector
The current gloom does not mean the economy is on a decline. The slow growth continues to buoy the materials sector, with this week being another big winner, +0.09% change.
Losers of the current week
Information Technology sector at — 3.9%
Consumer Discretionary sector at — 6.01%
Consumer Staples sector at — 8.88%
Jitters on looming inflation continue to mount. The equities have also been in a bullish sentiment bubble that seems to have finally burst. Coupled with less than expected earnings for top retailers and shunning of tech growth stocks due to heightened volatility, the three sectors above took this week’s beating brunt.
Below is a performance chart of the SP 500 over the week and its component sectors.
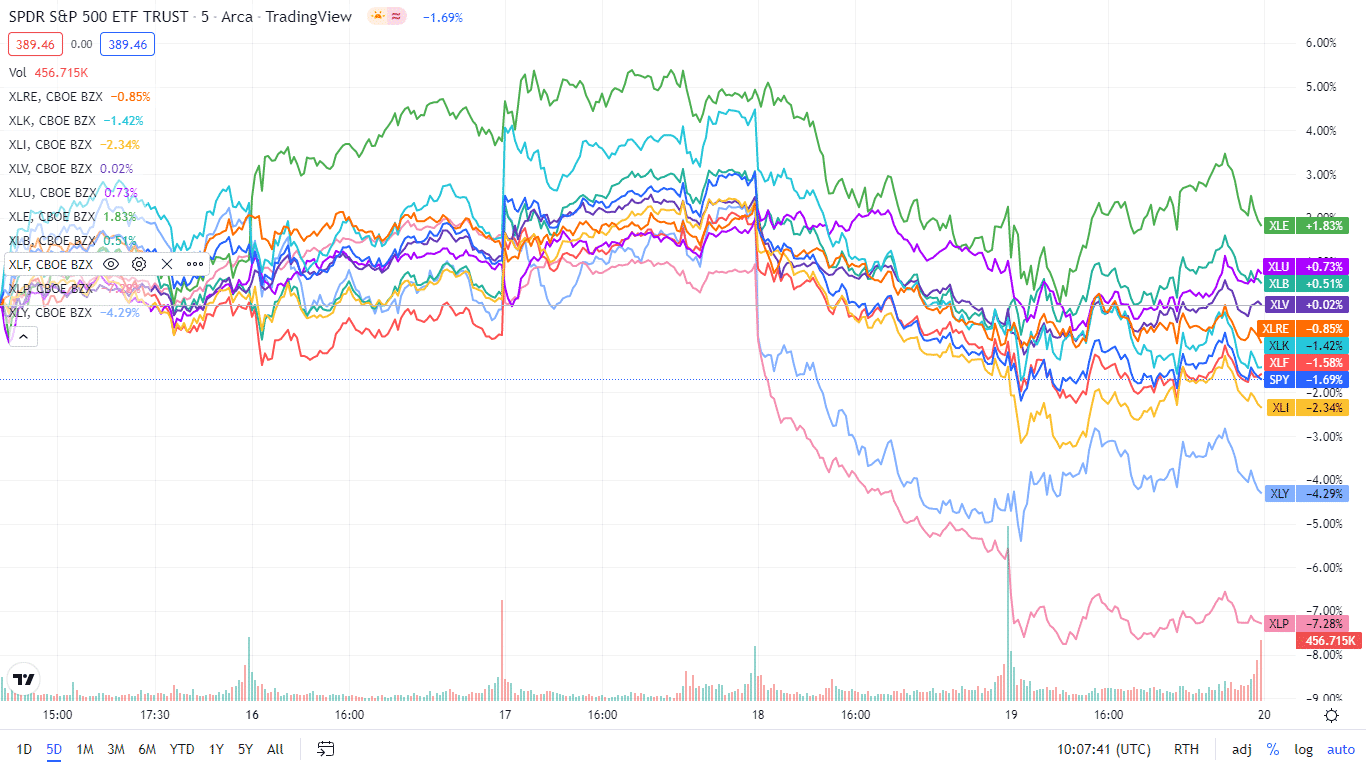
The S&P 500 individual sectors’ weekly chart
The following table shows how the S&P 500 ended the week, using their corresponding ETFs. It was another week of beatdown for the SPY majority of the sectors in the red.
The S&P 500 individual sector, weekly performance breakdown |
|||
| 1. | Energy | XLE | +0.65% with the accompanying energy select sector ETF |
| 2. | Utilities | XLU | +0.09% with the accompanying utilities select sector ETF |
| 3. | Materials | XLB | +0.09% with the accompanying materials select sector ETF |
| 4. | Healthcare | XLV | -0.35% with the accompanying healthcare select sector ETF |
| 5. | Financial Services | XLF | -1.65% with the accompanying financial select sector ETF |
| 6. | Industrial | XLI | -2.66% with the accompanying industrial select sector ETF |
| 7. | Communication Services | XLC | -2.81% with the accompanying communication services select sector ETF |
| 8. | Real Estate | XLRE | -2.91% with the accompanying real estate select sector ETF |
| 9. | Information Technology | XLK | -3.90% with the accompanying information technology select sector ETF |
| 10. | Consumer Discretionary | XLY | -6.01% with the accompanying consumer discretionary select sector ETF |
| 11. | Consumer Staples | XLP | -8.88% with the accompanying consumer staples select sector ETF |


Comments