
Despite the trade sanctions and the ongoing Ukraine-Russia war, Russia was able to pay its bond resulting in investors moving from gold back to US equities widely regarded as safe-havens. The result was the SPY finishing the previous week in the green, recording it as the best week for the SPY since November 2020.
Would the FED’s quarter-point rate hike result in bullish sentiment and another bullish week for the Spy, or would the markets slide down?
Monday’s market opening price of $444.50 continued the markets’ closing on Friday at the same price. This price was just below the yearly resistance level. Would the SPY break this resistance level, or would it hold? The week has been one largely sideways with bullish inclination, with prices testing this pivotal level throughout the week, but its integrity has proven itself repeatedly.
Powell’s statement on the state of the economy and kick-off of the quarter-point rate continues to drive the equity markets. Investors see this as a needle thread that balances inflation tolerance and a significant recession. Powell also confirmed that the FED deliberates on more aggressive strategies to talk inflation. The result of this statement was soaring in treasury yields, 20 basis points to reach 2.32%, to mark the worst month for this asset class since 2016. Couple this with investors’ sentiments on US stocks as a haven investment in the backdrop of the Ukraine-Russia war. You have the persistence of bullish investor sentiment, having the SPY finish in the green, +1.30%.
Top gainers of the current week
Energy sector
Russia retaliated on trade sanctions to declare that all Russian energy is to be paid with Rubles for countries deemed “unfriendly.” With the renewed rebound in oil prices, the energy sector had the most significant weekly change at +5.03%.
Materials sector
Powell’s statement on a mild check on inflation prices buoyed the materials sector to finish the week with a +2.96% change.
Information Technology sector
The weekly market correction continued for tech growth stocks to buoy it to another green week with a +2.42% weekly change.
Losers of the current week
Health Care sector at — 0.75%
Information Technology sector at — 0.86%
The Healthcare and Real Estate sectors closed the week negatively to deny the SPY another great bullish week for the current week.
Below is a performance chart of the SP 500 over the week and its component sectors.
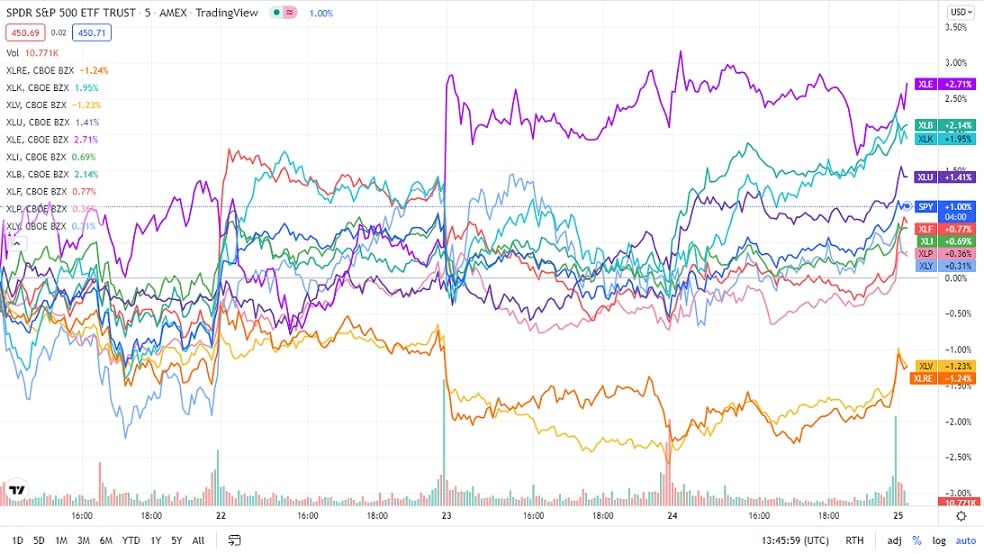
The S&P 500 individual sectors’ weekly chart
The following breakdown shows how the S&P 500 ended the week, using their corresponding ETFs. The SPY continued its bullish run with nine sectors finishing in the green.
The S&P 500 individual sector, weekly performance breakdown |
|||
| 1. | Energy | XLE | +5.03% with the accompanying energy select sector ETF |
| 2. | Materials | XLB | +2.96% with the accompanying materials select sector ETF |
| 3. | Information Technology | XLK | +2.42% with the accompanying information technology select sector ETF |
| 4. | Utilities | XLU | +1.94% with the accompanying utilities select sector ETF |
| 5. | Communication Services | XLC | +1.75% with the accompanying communication services select sector ETF |
| 6. | Consumer Discretionary | XLY | +1.15% with the accompanying consumer discretionary select sector ETF |
| 7. | Industrial | XLI | +0.52% with the accompanying industrial select sector ETF |
| 8. | Consumer Staples | XLP | +0.50% with the accompanying consumer staples select sector ETF |
| 9. | Financial Services | XLF | +0.35% with the accompanying financial select sector ETF |
| 10. | Healthcare | XLV | -0.75% with the accompanying healthcare select sector ETF |
| 11. | Real Estate | XLRE | -0.86% with the accompanying real estate select sector ETF |


Comments