Everyone thought April had reared the worst equity market bearish movement since the pandemic but May, if last week is anything to go by, seems hell-bent on pushing prices to their worst level since early 2021.
After another disappointing week for bullish investors, would their fortunes turn a corner, or would the inflation pressure continue weighing down on the markets?
An opening price of $405.03 did not spell any good news for optimistic investors. It was a 1.6% gap-down compared to the previous week’s closing price of $411.46. the worst thing was that this would prove to be the best price of the week because bears were in control from this point onwards. Despite a temporary respite between the $404.14 and $395.82 levels, a price channel held for close to three days, bulls would lose this tug of war, resulting in a continued price slide. Bears would push the prices down to the $385.75 level, a new low since early 2021.
This week was characterized by high volatility levels and significant sell-offs driven by jitters that the aggressive federal reserve rate hikes and policies to curb inflation would further hamper economic growth. A hotter than expected leading indicator of inflation, the consumer price index of 8.2% against an expected rate of 8.1%, was the last straw as equities accelerated their bearish run.
Coupled with the rising interest rates to deter inflation, geopolitical risk due to the Ukrainian war, and China’s shutdown due to Covid-19, experts predict continued bear pain for the foreseeable future. With everyone now agreeing that the SPY is in a bearish run, history points to an average price slide of 37% before the market correction. The SPY has slid 16% from its January high, meaning the selling pressure is still way off the bottom.
For the week, all of these, combined with an ever-increasing dollar strength that continues to hit on earnings, pushed the SPY to a -4.59% change.
Worst losers of the current week
Real Estate sector at — 6.27%
Information Technology sector at — 6.72%
Consumer Discretionary sector at — 7.21%.
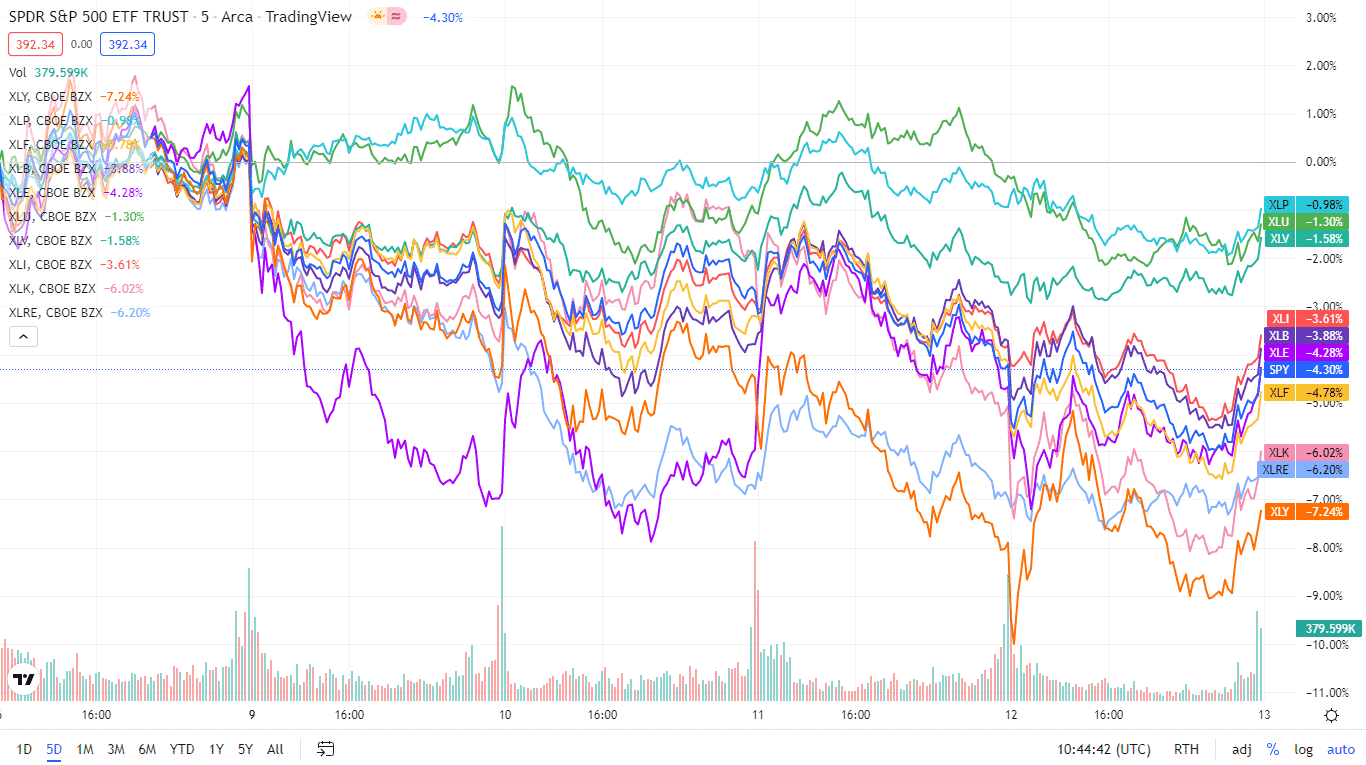
A turbulent week culminated in investor jitters about FED rate hikes pushing the economy to recession resulting in outflows from aggressive sectors into defensive sectors. As a result, the three sectors above were the hardest hit in a week where all sectors finished in the red. Below is a performance chart of the SP 500 over the week and its component sectors.

The S&P 500 individual sectors’ weekly chart
The following breakdown shows how the S&P 500 ended the week using its corresponding ETFs. It was another week of beatdown for the SPY, with all sectors losing out and finishing in the red.
The S&P 500 individual sector, weekly performance breakdown |
|||
| 1. | Consumer Staples | XLP | -1.11% with the accompanying consumer staples select sector ETF |
| 2. | Healthcare | XLV | -1.98% with the accompanying healthcare select sector ETF |
| 3. | Utilities | XLU | -2.39% with the accompanying utilities select sector ETF |
| 4. | Communication Services | XLC | -2.60% with the accompanying communication services select sector ETF |
| 5. | Industrial | XLI | -3.80% with the accompanying industrial select sector ETF |
| 6. | Materials | XLB | -3.96% with the accompanying materials select sector ETF |
| 7. | Financial Services | XLF | -4.88% with the accompanying financial select sector ETF |
| 8. | Energy | XLE | -6.09% with the accompanying energy select sector ETF |
| 9. | Real Estate | XLRE | -6.27% with the accompanying real estate select sector ETF |
| 10. | Information Technology | XLK | -6.72% with the accompanying information technology select sector ETF |
| 11. | Consumer Discretionary | XLY | -7.21% with the accompanying consumer discretionary select sector ETF |


Comments