
In a week filled with second-quarter reporting, the SPY is way off track. The current reports are way better than expected, but the SPY seems to be stuck on a rut.
Investors were apprehensive about the market after the dismal performance in the 5th to 9th July week. The market opened where it had left off with a price of $435.68. What followed was as come to be expected of the SPY, a price consolidation, then a launch of the previous week’s pivot point of $435.03-$435.10 level.
Will the S&P 500 form a new high compared to the previous week, or will it form a new low?
Rather than gap-up as has been the norm in recent weeks, the SPY took a steady bullish approach for two days to create a new high at $437.85, which has proven to be the weekly resistance level.
Despite all the good news streaming in on the US economic recovery in different sectors, the new high demonstrated a formidable resistance level and the SPY plummeting to $435.5 on the 13th. The 14th saw the market open at the same level, but Powell’s dovish acknowledgment in the senate saw the market gap up to trade in the new weekly resistance level of $437.85, only to see it hold firm.
Despite the market trading sideways for the rest of the week, the economic releases for quarter two show an economy on the brink of resurgence. Leading the excellent news is jobless claims at 360 thousand, the lowest since the pandemic.
Among the individual sectors making up the S&P 500 Index, the never-ending game of musical chairs is still afoot though the top spots seem to be the same culprits from last week.
Gainers of the current week:
Utilities Sector
It seems to be taking advantage of the investor jitters and being a safe haven. It is no surprise that it was on the green for a 2nd week running,+1.54%. The inflation rate has hit a staggering 5.4% while interest rates remain untouched.
Consumer Staples Sector
Therefore, it is not strange to have the rising demand for products driving investors to the consumer staples sector and their inflows resulting in a +1.09% positive change.
Real Estate Sector
Another safe-haven sector that seems to be benefitting from investors’ wait and see approach to the economic resurgence, the Real Estate. It had another week in the green, recording a +0.56% change.
Losers of the current week:
Sectors that continue to languish despite the record pace in economic recovery post-pandemic, for this week, are:
Energy Sector at -5.09%
Consumer Discretionary Sector at -1.40%
Materials Sector at -0.84%
These three sectors seem to be the first to take the brunt of investors and analysts’ belief that the economy will slow down and the recovery transition from a fast pace to a more simple and steady rhythm.
Here is a chart of the eleven sectors’ weekly performance and how they have fared against the S&P 500.
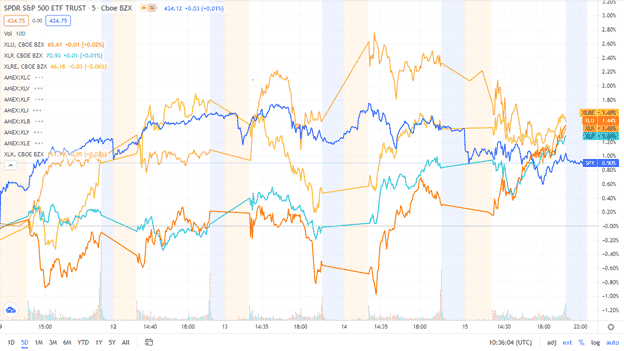
S&P 500 industry sector weekly performance breakdown |
|||
| 1. | Utilities | XLU | +1.54% with the accompanying utilities select sector ETF |
| 2. | Consumer Staples | XLP | +1.09% with the accompanying consumer staples select sector ETF |
| 3. | Real Estate | XLRE | +0.56% with the accompanying real estate select sector ETF |
| 4. | Information Technology | XLK | +0.36% with the accompanying information technology select sector ETF |
| 5. | Communication Services | XLC | +0.32% with the accompanying communication services select sector ETF |
| 6. | Healthcare | XLV | -0.03% with the accompanying healthcare select sector ETF |
| 7. | Financial Services | XLF | -0.23% with the accompanying financial select sector ETF |
| 8. | Industrial | XLI | -0.68% with the accompanying industrial select sector ETF |
| 9. | Materials | XLB | -0.84% with the accompanying materials select sector ETF |
| 10. | Consumer Discretionary | XLY | -1.4% with the accompanying consumer discretionary select sector ETF |
| 11. | Energy | XLE | -5.09% with the accompanying energy select sector ETF |


Comments