After a week that saw the SPY and the markets, in general, defy the Ukraine-Russia conflict to post a bullish week, all eyes were on markets for the new week.
Would the markets continue to show resilience, or would investor jitters kick in and bring them tumbling down?
After the previous week’s final hours of trading experiencing bearish pressure, the Monday market opening was a bit apprehensive. The markets opened at $431.41 price, which would prove to be the best price of the week. Even with the weekend break, the bear momentum seen at the previous week’s close was still present, and the SPY prices slid for two days to test the support at $415.9.
Luckily for bullish investors, this support held, and the bulls pushed the prices up to the previous week’s pivotal level of $426.91, took a rest, and then pushed upwards to test the $429.10. However, through the consumer price growth of 7.9%, inflation data cut short this correction with a 1.2% gap down to have prices trading in the $425.48 regions.
Against the backdrop of the Ukraine-Russia war, commodity prices continue to rise, fueled by supply chain bottlenecks and continued economic sanctions. Couple the unchecked inflation with rising oil prices due to the war, and investor jitters will continue to rise given that oil spikes have the potential to lead to recession. However, the headache rests with Powell and the FED cause despite hiking rates quarter-point and the markets accepting this as the new reality. They have to find a balance between the red hot inflation and tightening policies lest they cripple economic resurgence.
Top gainers of the current week
Energy Sector
The energy sector continues to soar on the back of Russian sanctions, which might severely hamper the oil supply.
OPEC is also not willing to raise its supply. With the global appetite for clean energy ensuring producers have to be cognizant of ESG factors, this bullish run might just be the beginning for the energy sector. It was the only sector to benefit from all the week’s misery to end with a +3.07% weekly change.
Losers of the current week
With all except for the energy sector is in the red, and the worst-hit sectors were:
Healthcare sector at — 1.99%
Information Technology sector at — 2.04%
Consumer Staples sector at — 4.69%
Red hot inflation, rising inflation, and the Ukraine-Russian conflict continue to hammer the markets and cause turmoil but those hardest hit resulting in the most significant investment outflows are those above.
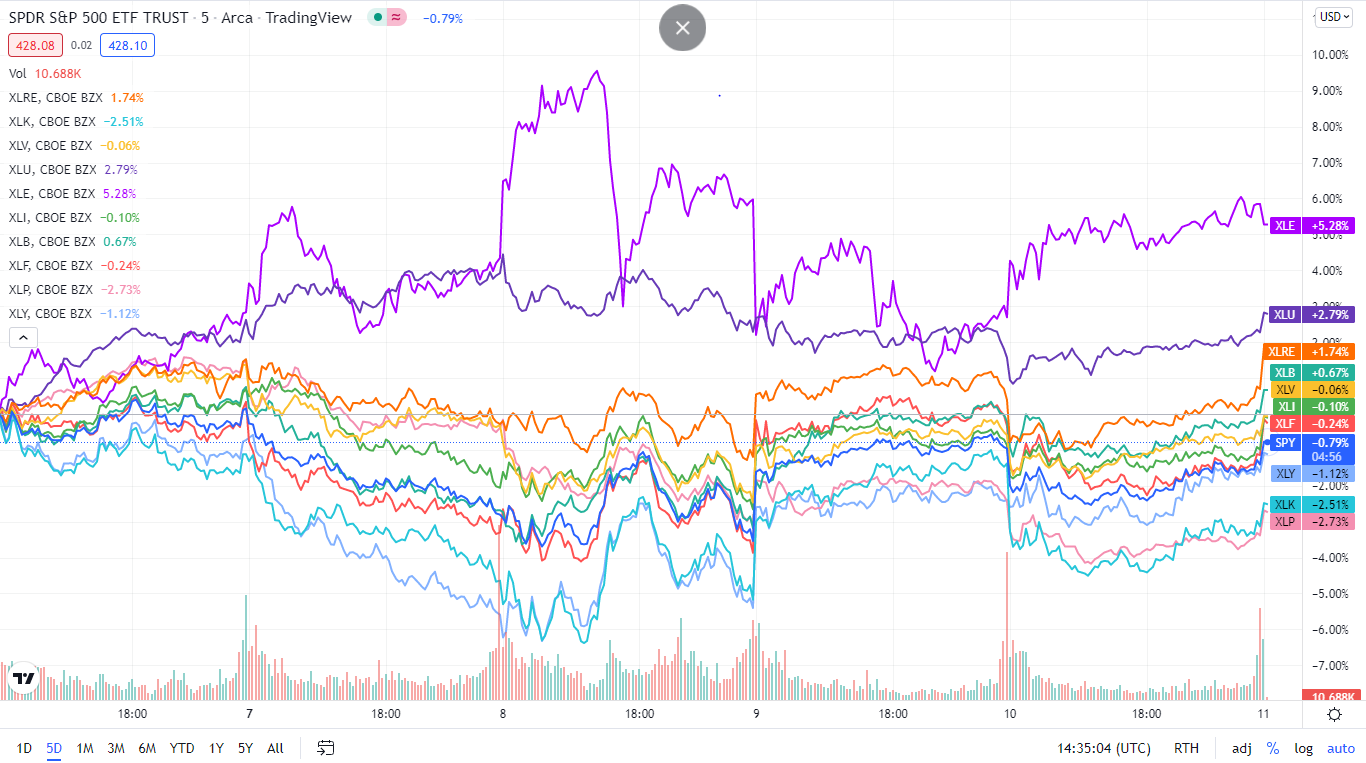
Below is a performance chart of the SP 500 over the week and its component sectors.

The S&P 500 individual sectors’ weekly chart
The following breakdown shows how the S&P 500 ended the week, using their corresponding ETFs. The SPY bear continues to growl, all sectors finishing the week in the red except for one.
The S&P 500 individual sector, weekly performance breakdown |
|||
| 1. | Energy | XLE | +3.07% with the accompanying energy select sector ETF |
| 2. | Utilities | XLU | -0.37% with the accompanying utilities select sector ETF |
| 3. | Consumer Discretionary | XLY | -0.82% with the accompanying consumer discretionary select sector ETF |
| 4. | Materials | XLB | -0.84% with the accompanying materials select sector ETF |
| 5. | Real Estate | XLRE | -0.87% with the accompanying real estate select sector ETF |
| 6. | Communication Services | XLC | -1.29% with the accompanying communication services select sector ETF |
| 7. | Financial Services | XLF | -1.52% with the accompanying financial select sector ETF |
| 8. | Industrial | XLI | -1.67% with the accompanying industrial select sector ETF |
| 9. | Healthcare | XLV | -1.99% with the accompanying healthcare select sector ETF |
| 10. | Information Technology | XLK | -2.04% with the accompanying information technology select sector ETF |
| 11. | Consumer Staples | XLP | -4.69% with the accompanying consumer staples select sector ETF |


Comments