
After more than five weeks of week-on-week positive change, and the 9th to 13th week that saw a new high after a convincing bullish run, the SPY upward progress seems to have come to a stop.
Is the S&P 500 finally done with this bullish run?
In a phenomenon that has become the S&P 500 norm, Monday market open exhibited a gap down to start trading at $444.95, a 0.1% gap down compared to the previous week’s close of $445.57%. In a fashion that has become the norm, the SPY then had a period of sideways market movement before establishing a bullish trend on Monday that resulted in a new monthly high of $447.23, before things took a drastic turn Tuesday.
Tuesday trading saw the markets open with yet another gap down of 0.4% to start the day’s trading at $446.62. It would seem that the raging debate of the Fed’s unchanging monetary policies and the slowing down of economic resurgence in light of the covid19 delta variant has caught up with the markets. The result is a fall in the heavy cyclical sectors, with the only positive postings for the week being either on tech-heavy industries or the traditional haven sectors. Since Tuesday’s gap down, the SPY fueled by these factors went on a bearish run that ended only after testing the July pivot level of $434.94.
The better-than-expected job market growth characterized by lower unemployment claims buoyed the SPY late Thursday and Friday to see it trading at the $439.89-$441.03 range.
However, the SPY is already deep in the red for the week, -1.29%, with the gains in tech shares proving inadequate to shove it to the green.
There was a complete overhaul of the chess game between the individual sectors, with all the participants making moves.
Gainers of the current week
Health care sector
In addition to being a haven investment, the health care sector is benefiting from an influx of funds. This spike in funds is attributable to the continuing race to create a top-of-the-shelf vaccine and cure for the coronavirus.
The result was a weekly change of +1.25% when almost all the other sectors were red.
Utilities sector
Another safe-haven investment option, the utility sector, has taken advantage of the rising consumer jitters to close the week at +0.58%.
Consumer staples sector
The utility sector and the consumer staples sector are peas in a pond, hence positively correlated. As such, it is a haven investment vehicle that took advantage of the cyclical market decline to close the week at +0.24%.
Losers of the current week
Sectors that took the brunt of the cyclical market downturn and effect of the spreading and economic-paralyzing Covid-19 delta variant was:
Consumer discretionary sector at -3.14%
Materials sector at -3.71%
Energy sector at -7.58%
Wall Street experienced a reevaluation of its forecasts for the economy. A few firms believed that the economy would grow at a lesser pace than expected, especially in the face of the recent Covid-19 Delta variant.
As a result of this, together with the cyclical market downturn, sectors not aligned to the defensive spectrum experienced massive sell-offs, with the above three industries taking the brunt of the bearish market movement. Data show a reduction in overall consumer confidence in the economy characterized by declining mobility and demand.
Below is a performance chart of the S&P 500 over the week and its component sectors.
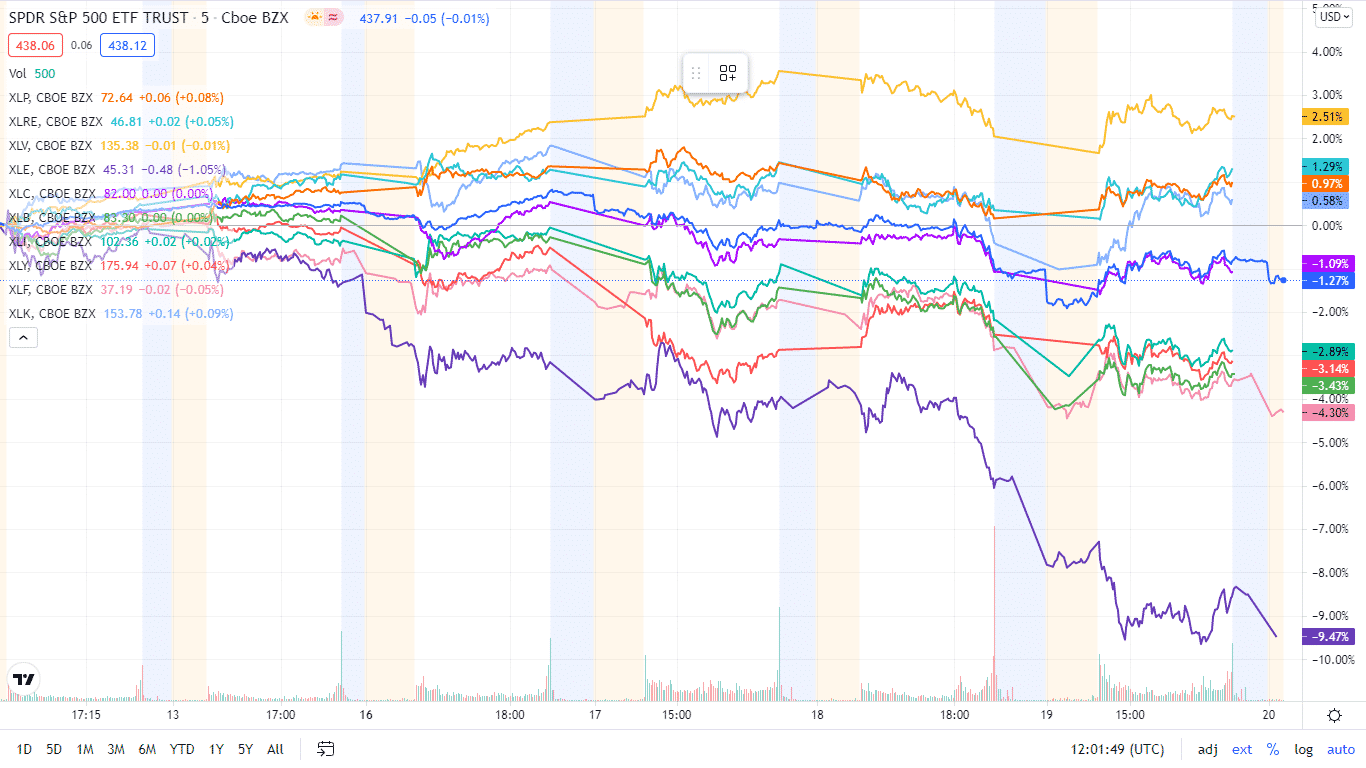
The S&P 500 individual sectors’ weekly charts
The following breakdown shows how the S&P 500 ended the week in the green by breaking down the individual sector performances using their corresponding ETFs.
| The S&P 500 individual sector, weekly performance breakdown | |||
| 1. | Healthcare | XLV | +1.25% with the accompanying healthcare select sector ETF |
| 2. | Utilities | XLU | +0.58% with the accompanying utilities select sector ETF |
| 3. | Consumer Staples | XLP | +0.24% with the accompanying consumer staples select sector ETF |
| 4. | Real Estate | XLRE | +0.09% with the accompanying real estate select sector ETF |
| 5. | Information Technology | XLK | -0.85% with the accompanying information technology select sector ETF |
| 6. | Communication Services | XLC | -1.33% with the accompanying communication services select sector ETF |
| 7. | Industrial | XLI | -2.57% with the accompanying industrial select sector ETF |
| 8. | Financial Services | XLF | -2.91% with the accompanying financial select sector ETF |
| 9. | Consumer Discretionary | XLY | -3.14% with the accompanying consumer discretionary select sector ETF |
| 10. | Materials | XLB | -3.71% with the accompanying materials select sector ETF |
| 11. | Energy | XLE | -7.58% with the accompanying energy select sector ETF |


Comments