
The ugly truth is, despite overall being in a bullish market, in the short term, the SPY is still in a vicious seesaw sideways market.
In previous weeks, the SPY Monday morning opening has been synonymous with a market gap down. The first week of August and the first trading day saw the end of this era, with the market continuing where it had left off and opened at $440.13; the previous week’s close was $ 439.09, a 0.2% gap up.
Was the new month opening a harbinger of good news and the end of the S&P 500 sideways seesaw?
Unfortunately for SPY investors, the resurgence of the Covid-19 virus would prove too much for the slight momentum. It went back to its up and down pattern, testing the July pivot table of $436.32-$438, before using it as a launchpad to test the previous trading weeks, 26th July to 30th July, of $441.73 on Friday.
Many companies are declaring biannual profits, and the jobless claims figures being better than anticipated show that the economy is recovering faster than expected. However, investors seem jittery given the spread of the Delta coronavirus variant and have gone back to pumping investments into sectors believed to be safe havens.
Nevertheless, SPY replicated the performance of the last week of July to close the week in the green +0.77%. This weekly change is quite the let off given the opening price and all the excellent news streaming in from individual companies and economic sectors on the mid-year performance.
A look at the individual S&P 500 sectors shows that the never-ending chess game is still afoot, with different sectors exchanging chess pieces.
Gainers of the current week
Utilities sector
The utilities sector experienced an influx of investments being the top go-to investment in times of investor jitters to close the week at a whooping + 2.37%.
Financial Services sector
The best thing about the financial services sector is that as long as any other sector is in the post-pandemic recovery, they will need the finances to reach desired capacities. As such, this sector rode on the backs of the utilities and consumer discretionary sectors to close the week at +1.52%.
Consumer Discretionary sector
Being a safe-haven sector and on the back of a better jobless claims outlook, the consumer discretionary sector took a bullish turn to post a +1.12% weekly change.
Losers of the current week
Sectors that took the brunt of bleak Delta variant coronavirus updates and the rising investor jitters of the economy resuming as soonest possible are:
Consumer Staples sector at -0.5%
Energy sector at -0.6%
Materials sector at -1.29%
These sectors are heavily reliant on the economy achieving normalcy post-pandemic. With the rising investor skepticism on the economic growth slowing down on the back Covid-19 cases resurgent, it is no surprise that they are red.
Here is a chart of the eleven sectors’ weekly performance and their fares against the S&P 500.
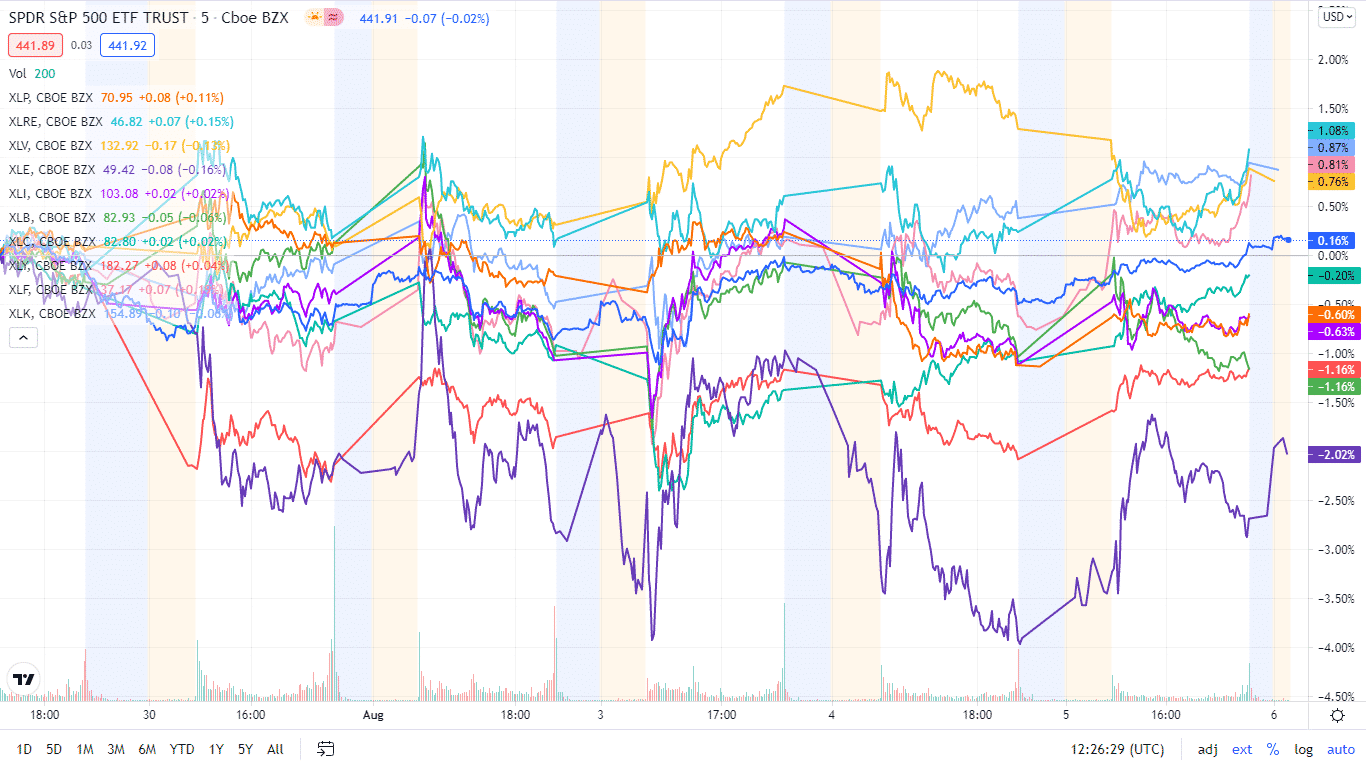
The S&P 500 individual sectors’ weekly charts
The overall performance of the SPY saw it close the week and month in the green. Below is a breakdown of the S&P 500 underlying sectors and their performance over the week, from 2nd to 6th August week, using their corresponding ETFs.
The S&P 500 individual sector, weekly performance breakdown |
|||
| 1. | Utilities | XLU | +2.37% with the accompanying utilities select sector ETF |
| 2. | Financial Services | XLF | +1.52% with the accompanying financial select sector ETF |
| 3. | Consumer Discretionary | XLY | +1.12% with the accompanying consumer discretionary select sector ETF |
| 4. | Information Technology | XLK | +1.06% with the accompanying information technology select sector ETF |
| 5. | Real Estate | XLRE | +0.93% with the accompanying real estate select sector ETF |
| 6. | Healthcare | XLV | +0.78% with the accompanying healthcare select sector ETF |
| 7. | Communication Services | XLC | +0.76% with the accompanying communication services select sector ETF |
| 8. | Industrial | XLI | -0.24% with the accompanying industrial select sector ETF |
| 9. | Consumer Staples | XLP | -0.5% with the accompanying consumer staples select sector ETF |
| 10. | Energy | XLE | -0.6% with the accompanying energy select sector ETF |
| 11. | Materials | XLB | -1.29% with the accompanying materials select sector ETF |


Comments