
The previous week, 6th to 10th September, saw a record 4-day bearish run for the SPY for the first time since March.
Would the new week confirm the yearly September equity market challenges, or would the SPY continue its record-breaking upward run?
Over the years, September has proven to be the worst-performing month of the year for the markets. However, Covid-19 changed global trends in so many ways that investors waited anxiously to see if the same was true for US equity markets. Unfortunately for SPY investors, this month of doom for equities seems not to understand that the world has changed.
After last week’s opening trading that saw the SPY gap down as opposed to its recent trend of week-opening gap up, investors were apprehensive about seeing what this week’s opening would sweep up. Given the bearish week it had, the Monday opening price of $448.65 came as a surprise given last week’s close of $445.5, a 0.7% gap up. Unfortunately, in a similar fashion to last week, this opening price would prove to be the highlight of the SPY for the whole week.
Bearish traders took control of the market from the opening price, with investor sentiments on a slowing down coupled with sooner than expected FED tapering fueling a bearish. This bearish run took momentary rest at the $447.94 region, a pivot level for August, before continuing its downward slide to test yet another August pivot level at the $444.49 range.
With their backs against the wall, the SPY bull investors used this level to launch a corrective bullish run. Coupled with positive Consumer Price Index data, year on year rise of 4.1%, the fastest pace since March of 2003, the bulls pushed the prices back upwards to the pivot level range of $447.94, as they awaited the retail data on Thursday. The air was taken off the bullish hot air balloon by higher-than-expected jobless claims data, pushing the prices down to trade in the $447.49 — $447.15 range on Friday.
There is a disconnect between equity valuation in the markets and consumer sentiments and risk appetites in the face of mixed data on the economic recovery pace. As such, despite the higher-than-expected jobless claims, retail sales have improved, resulting in mixed investor funds the flow between safe-haven sectors and more economically attuned sectors.
Gainers of the current week
Energy sector
The meeting between Biden and the Chinese president, coupled with their appeal to OPEC for increased oil supply to spur a fast-paced global economic recovery, has favored inflows into this sector. Coupled with the soaring prices of natural gas and what you get is a +4.10% weekly change.
Consumer Discretionary sector
With the consumer price index data being positive, it is no wonder that this sector posted another positive week, +0.92%, despite the SPY being red.
Information Technology Sector
With the slide in Chinese stocks and its primary competitor for the US tech and information technology sectors, the information technology sector experienced inflows to close the week at +0.85%.
Losers of the current week
Sectors that took the brunt of the economic good news were:
Industrial sector at — 0.52%
Materials sector at — 1.19%
Utilities sector at — 1.54%
Even with mixed economic data coming in, investors, despite being bullish, can now agree that the pace of economic resumption post-pandemic has slowed, resulting in shifting investor fund inflows from the Industrial and Materials sectors to the other investment aggressive sectors.
The utilities sector also took the brunt of the mixed economic news and better than expected consumer index data to close the week in the red.
Below is a performance chart of the S&P 500 over the week and its component sectors.
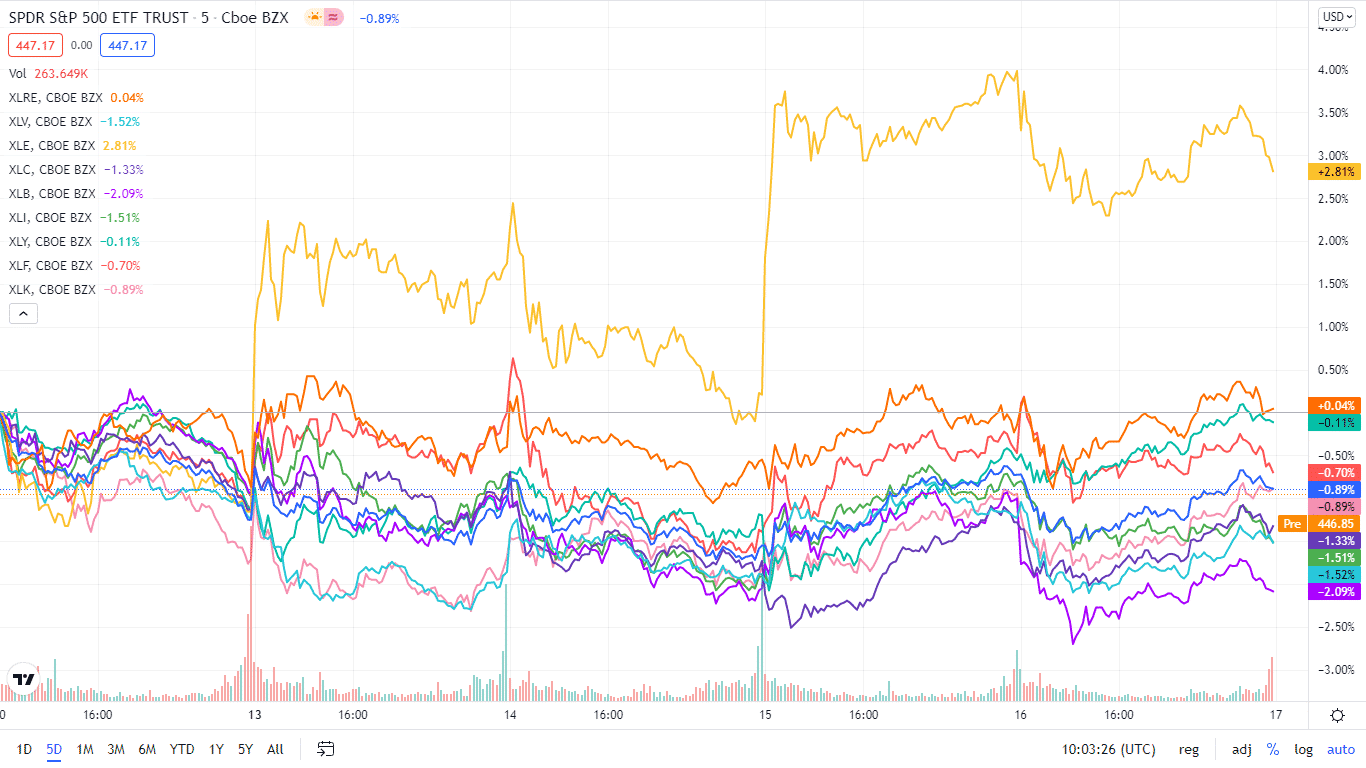
The S&P 500 individual sectors’ weekly chart
The S&P 500 individual sectors’ weekly chart
The following breakdown shows how the S&P 500 ended the week in the green by breaking down the individual sector performances using their corresponding ETFs.
The S&P 500 individual sector, weekly performance breakdown |
|||
| 1. | Energy | XLE | +4.10% with the accompanying energy select sector ETF |
| 2. | Consumer Discretionary | XLY | +0.92% with the accompanying consumer discretionary select sector ETF |
| 3. | Information Technology | XLK | +0.85% with the accompanying information technology select sector ETF |
| 4. | Real Estate | XLRE | +0.71% with the accompanying real estate select sector ETF |
| 5. | Financial Services | XLF | +0.40% with the accompanying financial select sector ETF |
| 6. | Communication Services | XLC | +0.03% with the accompanying communication services select sector ETF |
| 7. | Healthcare | XLV | -0.3% with the accompanying healthcare select sector ETF |
| 8. | Consumer Staples | XLP | -0.37% with the accompanying consumer staples select sector ETF |
| 9. | Industrial | XLI | -0.52% with the accompanying industrial select sector ETF |
| 10. | Materials | XLB | -1.19% with the accompanying materials select sector ETF |
| 11. | Utilities | XLU | -1.54% with the accompanying utilities select sector ETF |


Comments