
The previous week, 16th August to 20th August, saw a bullish run of more than five weeks erode in a single trading day that left it in the red and many investors in pain. The SPY would recollect closing the week at $443.56, not the previous week’s high but at least within the month’s pivot level.
Would the new week be a continuation of this recollection or another heartbreak for investors?
So used to a Monday market open gap down, the SPY had other ideas in mind. It opened with a 0.3% gap up to start the week’s trading at $445.1. This phenomenon was followed by a solid day of the bulls being in charge of the market and driving it to test the previous monthly high of $447.27.
However, given the predicates of the SPY in the previous weeks to give investors a high and then retrace, the bullish run wanted to see it start the now mundane but predictable sideways market investors have come to expect day in day out. After breaking the monthly high of $447.27, the pull between bears and bulls stalled any upward or downward momentum for Tuesday and Wednesday, with the SPY trading in the $447.46-$448.35 regions. The debate on whether Powel will announce the start of FED monetary policies tapering seems to be skewed towards the nays attributable to the Thursday bullish surge to a new monthly high of $449.45.
Unfortunately, the higher-than-expected jobless claims tapered off this bullish run started a market decline. The killing of US soldiers in Afghanistan coupled with the jitters surrounding FED’s symposium Jackson Hole acted as an accelerant.
The good news is that the gains in the last week had the SPY solidly in the green, +1.37%, despite it sliding to trade on Friday in the $447.06-$447.57 regions.
Between the individual sectors making up the S&P 500, a complete shift in the chess game that has been ongoing was experienced.
Gainers of the current week
Energy sector
The positive numbers of the growth rate of the economy, 6.6% compared to the expectation of 6.5%, seem to have moved investors back to the so-called aggressive sectors. The energy sector is at the forefront of taking advantage of this good news, as exhibited by its weekly change of +4.60%. This positive change seems to be a challenge to the markets because it came in a week that saw some energy bigwigs slide to the red; Occidental Petroleum by -2.5%, Halliburton by -1.9%, among others.
Financial Services sector
Better economic data means more confidence in the markets and a need for refinancing, catapulting this sector to a weekly positive change of +2.14%
Consumer Discretionary sector
Another go-to sector in times of economic boom, it is no wonder that the better-than-expected economic data had investment inflows to this sector resulting in a 1.7% positive change.
Losers of the current week
Sectors that took the brunt of the economic good news were:
Real Estate sector at -1.2%
Consumer Staples sector at -1.7%
Utilities sector at -2.08%
Historically, these three sectors are safe-haven investment vehicles hence discarded by investors in a bullish market. Despite jitters surrounding the FED symposium, 56% of wall street analysts seem to agree that the market is still bullish. Couple this with the positive economic data, and what you have is investor confidence and a shift from defensive sectors.
Below is a performance chart of the S&P 500 over the week and its component sectors.
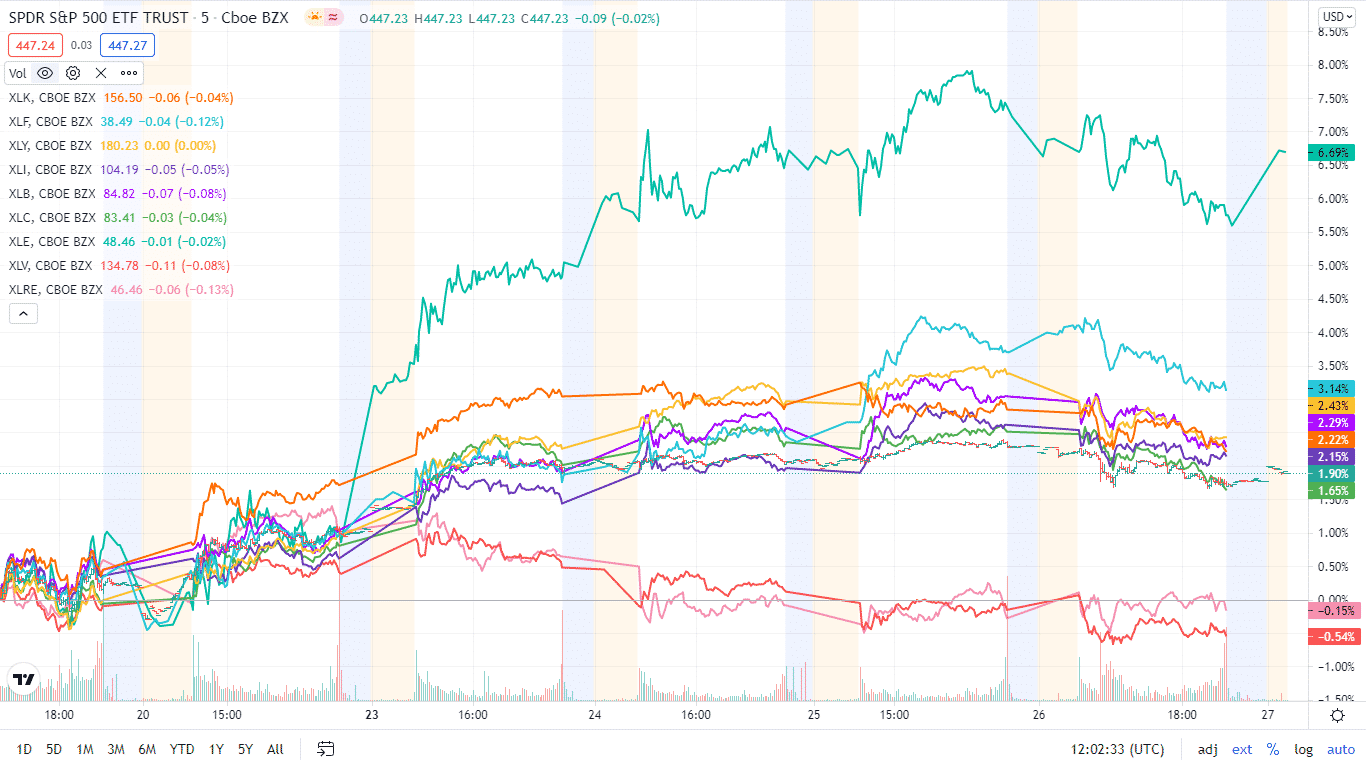
The S&P 500 individual sectors’ weekly chart
The following breakdown shows how the S&P 500 ended the week in the green by breaking down the individual sector performances using their corresponding ETFs.
| The S&P 500 individual sector, weekly performance breakdown | |||
| 1. | Energy | XLE | +4.60% with the accompanying energy select sector ETF |
| 2. | Financial Services | XLF | +2.14% with the accompanying financial select sector ETF |
| 3. | Consumer Discretionary | XLY | +1.7% with the accompanying consumer discretionary select sector ETF |
| 4. | Industrial | XLI | +1.52% with the accompanying industrial select sector ETF |
| 5. | Materials | XLB | +1.25% with the accompanying materials select sector ETF |
| 6. | Communication Services | XLC | +1.18% with the accompanying communication services select sector ETF |
| 7. | Information Technology | XLK | +0.46% with the accompanying information technology select sector ETF |
| 8. | Healthcare | XLV | -1.02% with the accompanying healthcare select sector ETF |
| 9. | Real Estate | XLRE | -1.20% with the accompanying real estate select sector ETF |
| 10. | Consumer Staples | XLP | -1.70% with the accompanying consumer staples select sector ETF |
| 11. | Utilities | XLU | -2.08% with the accompanying utilities select sector ETF |


Comments