
After the SPY performance in the last week of June, a +0.92%, investors saw it as a settling of the economy post-pandemic, and all waited with bated breath for the start of a bullish run.
After closing the 28th June — 2nd July trading week in the green, after compromising the monthly resistance level and trading way above it, a weekly close of $433.97, the highest price for over a month, pointed to a continuation of the bullish trend come Tuesday morning.
Will the S&P 500 open with a gap up signaling continuation of the bullish run established the previous week, off the monthly resistance now turned support?
Rather than open with a gap up, the SPY continued from where it had left off the previous week, open price of $433.97. However, rather than a bullish take-off, it took a nosedive the whole day on Tuesday before re-correcting. As such, the 4th July festivities mood was short-lived.
The market, it seems, is not yet ready to grant SPY the independence to soar higher. The market could only sustain the bullish re-correction rally up to the $434.73 level. Thursday witnessed large-scale sell-offs on news of the 10-year Treasury yield plunge.
Markets opened with a gap down to trade at $429.39. The delta Covid19 variant sweeping across the globe now has many investors questioning the viability of economic resumption to complete normalcy in 2021. These two factors are attributable to the slowdown of macroeconomic activities at present.
Among the individual sectors making up the S&P 500 Index, the never-ending game of musical chairs persists.
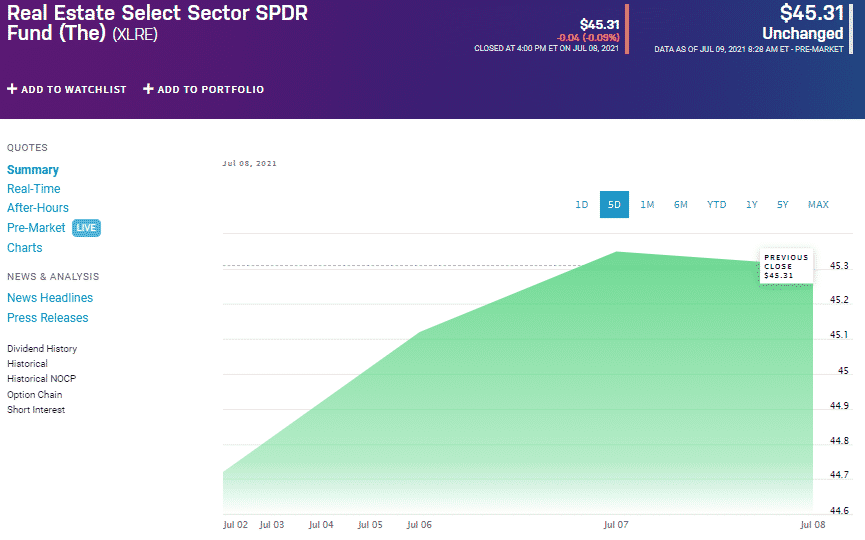
- The Real Estate sector, a safe haven instrument, took advantage of the growing jitters to record a weekly bullish surge of +1.31%.
- The Utilities Sector, another safe haven option for investors, also saw an influx of investment activities, recording a positive weekly change, +0.79% is driving a post-pandemic global shift in how we carry out every facet of our lives.
- Despite the rapid spread of the Delta Coronavirus variant, the healthcare sector seems to provide hope to the masses, evidenced by its +0.05% weekly change.
These three sectors have been strategically poised to make a killing during resumption to economic normalcy. It is, therefore, no surprise that the realization of post-pandemic resumption is still a ways off, and the slowing down of economic activity has resulted in their downturn.
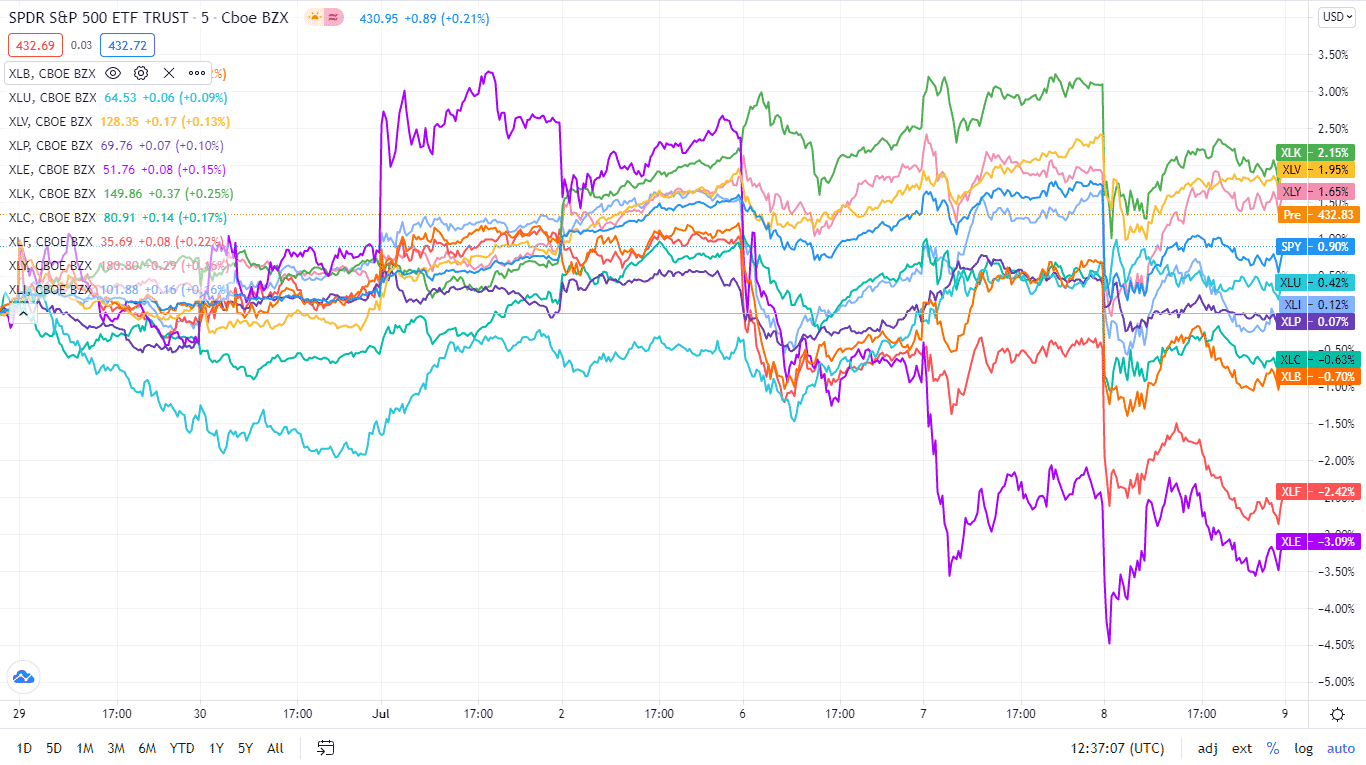
Here is a chart of the eleven sectors’ year-to-date performance and how they have fared against the S&P 500.
S&P 500 industry sector weekly performance breakdown |
|||
| 1. | Real Estate | XLRE | +1.31% with the accompanying real estate select sector ETF |
| 2. | Utilities | XLU | +0.79% with the accompanying utilities select sector ETF |
| 3. | Consumer Discretionary | XLY | +0.65% with the accompanying consumer discretionary select sector ETF |
| 4. | Healthcare | XLV | +0.05% with the accompanying healthcare select sector ETF |
| 5. | Information Technology | XLK | -0.07% with the accompanying information technology select sector ETF |
| 6. | Consumer Staples | XLP | -0.16% with the accompanying consumer staples select sector ETF |
| 7. | Communication Services | XLC | -1.24% with the accompanying communication services select sector ETF |
| 8. | Industrial | XLI | -1.37% with the accompanying industrial select sector ETF |
| 9. | Materials | XLB | -1.79% with the accompanying materials select sector ETF |
| 10. | Financial Services | XLF | -3.40% with the accompanying financial select sector ETF |
| 11. | Energy | XLE | -5.31% with the accompanying energy select sector ETF |


Comments