
The S&P 500 closed the June month with a flurry of activity, ensuring that July trading started above the monthly resistance level of $424.45-$424.60 range, a breath of fresh air and hope for bullish investors.
After closing the 21st-25th June trading week in the green and just above the monthly resistance level it had been flirting with for several weeks, close price of $426.57, Monday morning was full of jitters.
Will the S&P 500 open with a gap down for the level to continue asserting dominance?
The SPY opened with a gap up, the opening price of $427.17. It then flirted with the monthly resistance to confirm the levels flip to support, which it then used as a launchpad for a bullish run that had it trading at the $430-$430.5 range on Friday.
The SPY, therefore, points to a settling of the US economy and the start of the expected stock market bullish rally post-pandemic, a +0.92% weekly change. This increase saw the SPY hit Wallstreet’s 2021 forecasted target in six months.
Among the Individual sectors making up the S&P 500 Index, the never-ending game of musical chairs is still afoot.
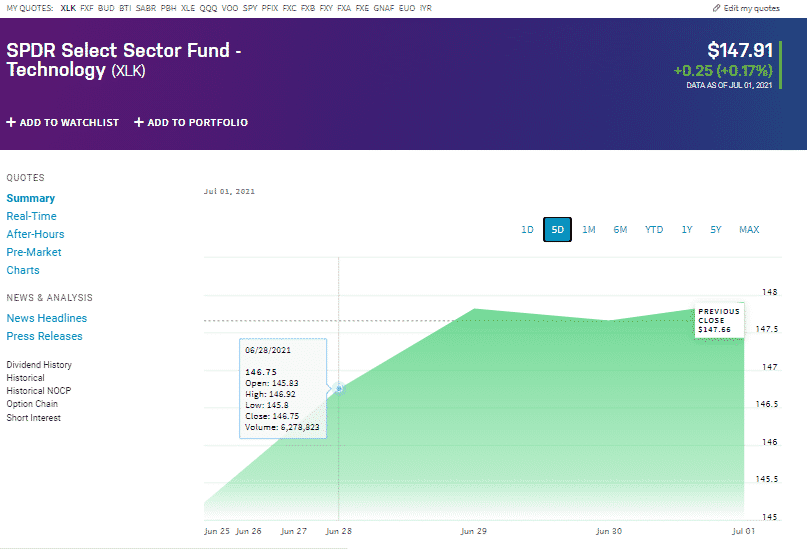
- The Information Technology sector took the bull by the horns to lead the SPY bullish rally with a +1.83% weekly surge.
- The Tech industry is driving a post-pandemic global shift in how we carry out every facet of our lives.
- The healthcare sector provided the global community with the good news that the Johnson & Johnson vaccine was effective against the Delta Coronavirus variant. It is no wonder then that the next biggest sector to gain was healthcare, with a + 1.12% weekly change.
The recent commitment by all social-media big boys to curbing cyberbullying, especially for minorities, drove the markets. World wide web creator Tim Bernes also sold the world wide web NFT source code on auction for $5.4 million.
Sectors holding back the S&P 500 were the Utilities Sector at -0.10%, the real estate sector at -0.51%, and the Energy Sector at -0.88%. The continued drop in the utility sector is attributable to investors’ shift to the other sectors since it is a haven for a market downturn. Mortgage rates have gone up again, effectively reducing real estate investment which explains its weekly negative drop.
Natural gas stocks recorded below expectation while OPEC continues to show increased crude oil supply. Such numbers are responsible for the slowed-down investment in the energy sector.
Here is a chart of the eleven sectors’ year-to-date performance and how they have fared against the S&P 500.
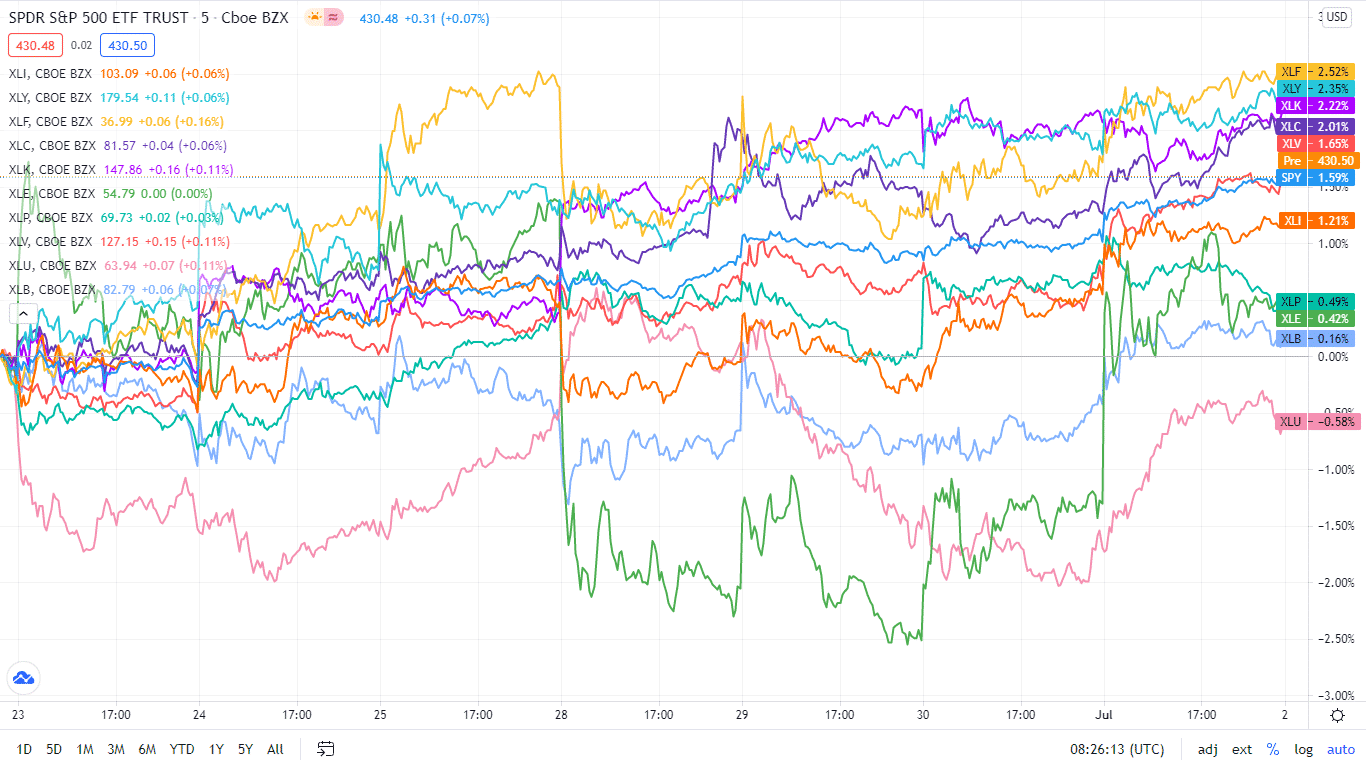
Below is a breakdown of the S&P 500 underlying sectors and their performance over the week from 28th June to 2nd July week, using their corresponding ETFs.
S&P 500 industry sector weekly performance breakdown |
|||
| 1. | Information Technology | XLK | +1.83% with the accompanying information technology select sector ETF |
| 2. | Healthcare | XLV | +1.12% with the accompanying healthcare select sector ETF |
| 3. | Consumer Discretionary | XLY | +0.98% with the accompanying consumer discretionary select sector ETF |
| 4. | Communication Services | XLC | +0.95% with the accompanying communication services select sector ETF |
| 5. | Materials | XLB | +0.73% with the accompanying materials select sector ETF |
| 6. | Industrial | XLI | +0.68% with the accompanying industrial select sector ETF |
| 7. | Financial Services | XLF | +0.09% with the accompanying financial select sector ETF |
| 8. | Consumer Staples | XLP | +0.05% with the accompanying consumer staples select sector ETF |
| 9. | Utilities | XLU | -0.10% with the accompanying utilities select sector ETF |
| 10. | Real Estate | XLRE | -0.51% with the accompanying real estate select sector ETF |
| 11. | Energy | XLE | -0.88% with the accompanying energy select sector ETF |


Comments