ETF full name: SPDR S&P Bank ETF
Segment: Banking institutions
ETF provider: SDPR
| KBE key details | State Street |
| Issuer | SDPR |
| Dividend | $0.24 |
| Inception date | November 8, 2005 |
| Expense ratio | 0.35% |
| Management company | SDPR |
| Average 3-5 EPS | 13.38% |
| Average Annualized Return | 74.03% |
| Investment objective | Replication |
| Investment geography | Banking sector |
| Benchmark | S&P Banks Select Industry Index |
| Leveraged | N/A |
| Median market capitalization | $28.64 billion |
| ESG rating | MSCI 5.24/10 |
| Number of holdings | 96 |
| Weighting methodology | Weighted Market capitalization |
About the KBE ETF
SPDR S&P Bank ETF KBE was founded in 2008, and it aims to track the S&P Banks Select Industry Index. It boasts a market capitalization of $28.64, while its annual return came in at 74.03%.
KBE Fact-set analytics insight
The KBE comprises 96 United States-based holdings. All of the fund’s holdings are financial institutions, while more than 85% are banks. The rest fall under the categories of diversified banks, and asset management, and custody lenders.
The exciting thing about the KBE fund is that not one holding stands significantly higher than others in terms of the pull in the fund. All top ten holdings in the fund have a combined weight of just above 13%, while the ETF’s top asset accounts for less than 1.5% of the pull.
The KBE, like other ETFs based on the S&P index, uses weighted market capitalization for its methodology.
KBE performance analysis
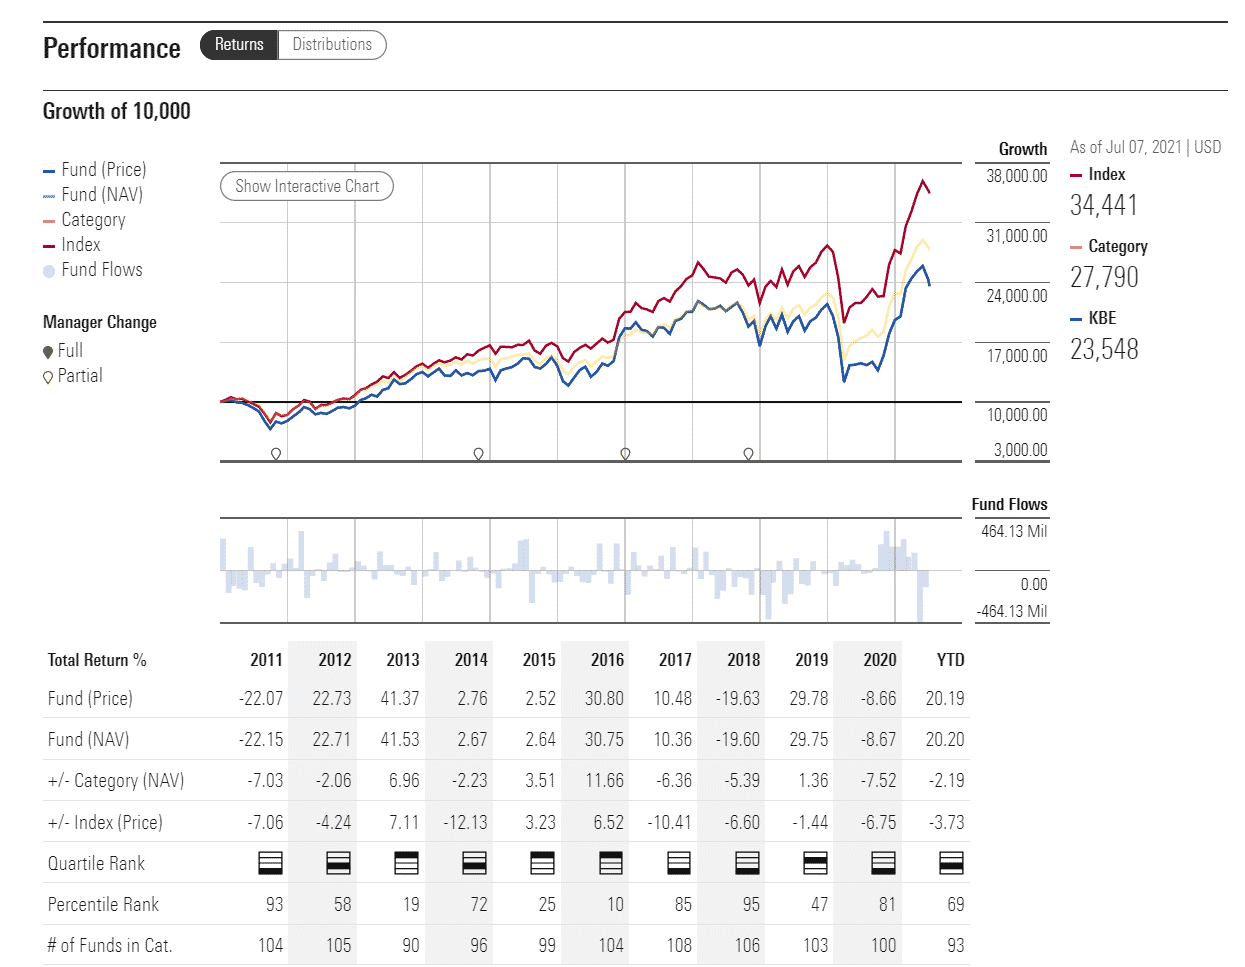
You can see the one non-recovery-related spike from the end of June when the Federal Reserve backpedaled its decision to forbid the banks to pay out dividends to their shareholders. Most of the biggest names in the industry took the chance, with some of them doubling the quarterly dividends.
The KBE ETF pays dividends four times a year. For the last quarter, the dividend amounted to $0.34 on the share at an expense ratio of 0.35%.
On the MSCI ESG scale, KBE ETF has a 5.24/10 triple-B rating. The fund was declared to be of lower-than-average resilience in environmental, governmental, and social changes.
KBE ETF RATING |
|||||
| Resource | ETF DATABASE | ETF.com | MarketWatch | Morningstar.com | Money.usnews.com |
| KBE Rating | BBB | BBB | 4 | * | 5.9/10 |
| KBE ESG Rating | 5.24/10 | BBB | 72nd percentile | N/A | N/A |
KBE key holdings
The ETF does a pretty solid job representing the entire US banking sector without a holding that would stand out in terms of the share within the fund.
Like with other banks, most of the holdings offer solid turnovers in relatively short bouts of time. On the other hand, high returns come at the cost of increased volatility, as the Covid-19 crisis showed.
Here are the top 10 holdings making up the KBE ETF.
| Ticker | Holding name | % of assets |
| SI | Silvergate Capital Corp. Class A | 1.49% |
| BK | Bank of New York Mellon Corporation | 1.34% |
| PNC | PNC Financial Services Group, Inc. | 1.33% |
| SIVB | SVB Financial Group | 1.32% |
| SBNY | Signature Bank | 1.32% |
| EWBC | East West Bancorp, Inc. | 1.32% |
| PNFP | Pinnacle Financial Partners, Inc. | 1.32% |
| HBAN | Huntington Bancshares Incorporated | 1.31% |
| FRC | First Republic Bank | 1.31% |
| CBSH | Commerce Bancshares, Inc. | 1.31% |
Industry outlook
Keeping in mind that the banking sector comes hand in hand with higher volatility, this ETF may not be the best option for long-term investors following a buy-and-hold strategy.
As far as the industry outlook is concerned, predicting the fund’s movement will require looking at the big picture. Like we already established, banks depend on almost all major economic sectors. For that reason, this fund is likely to profit if the recovery keeps the current pace, especially in the United States.
The US private sector has shown a bit of a slowdown in June instead of recording high activity levels observed a month before. The inflation rate also poses a risk that worries a majority of the investors, despite countless reassurances coming from the Fed about the price hike being transitory.
If you desire to get a more precise forecast and anticipate how the fund may do in the future, it would be wise to keep an eye on vital economic reports like nonfarm payrolls, PMIs, industrial production, etc., inflation rate.


Comments