
It seems as though, finally, the short-term investors in the SPY have something to smile about. Despite the Monday morning market open conforming to what investors have become accustomed to, the market gap was down, the opening price was the lowest price it recorded for the whole week.
The week opened at $441.65, a -0.2% gap down compared to the previous week’s, August 2nd to August 6th, close of $442.4.
Would the August 9th to 13th trading week be another sideways seesaw, or would the SPY break its duck?
After a bit of sideways but bullish market movement of the first three days of the week, the SPY short-term trend caught up to the long-term bullish trend established earlier in the year. This change in fortunes is mainly attributable to data that despite the resurging coronavirus pandemic, the economy is still on course for recovery, albeit at a slowed pace at present, as evidenced by better-than-expected news on the inflation rates; both consumer and input prices.
With investors unsure of when the Fed will finally step in to halt assets’ purchasing, inflation data, nonfarm payroll data, and labor statistics seem to be the forces driving the stock market enthusiasm. Week-on-week streaming of economic and organizational data that appears to support a growing economy drove the investors into a bullish frenzy that saw the SPY trade a new high, $444.9-$445.2 range on Friday.
The weekly bullish run shows an even bullish trend with a weekly change of +0.67%. It is true that the SPY has had a better weekly change in the previous weeks but after a chaotic and unpredictable market movement. The smoothness of the charts this week is something many investors have longed for, for several weeks now.
As more companies declare their midyear financials and the economic sectors analyze their fundamentals going into Q3, the individual S&P 500 sectors are still at their never-ending chess game.
Gainers of the current week
Materials sector
Lower than expected manufacturing inflation rates mean cheaper inputs, which drive investments to capitalize on economic resumption. It resulted in the most significant weekly jump of the week at + 2.76%.
Financial services sector
Lower than expected inflation rates do not mean cheap investment. Firms still need finances to resume full capacity and deal with the consumer inflation-driven demand picking up pace. As such, the financial services sector took advantage of the influx of investments in both materials and industrial sectors to close the week at +1.63%.
Industrial sector
The materials and industrial sectors are joined on the hip. Therefore it comes as no surprise that there was an influx of investments in this sector. It closed the week at +1.68%.
Losers of the current week
Sectors that seem to be lagging on the back of better-than-expected economic statistics for the week are:
Healthcare sector at -0.07%
Information technology sector at -0.47%
Real estate sector at -0.67%
The real estate sector is a haven investment option; hence the drop in its investment is attributable to investor focus on the more lucrative sectors.
There still seems to be a shortage of semiconductors globally, and these chipsets drive the information technology sector hence the slowing down of its upward trajectory. The healthcare sector seems to be under siege by the Covid-19 virus, with the CDC expected to allow for additional coronavirus injections for immunocompromised people.
Below is a performance chart of the S&P 500 over the week and its component sectors.
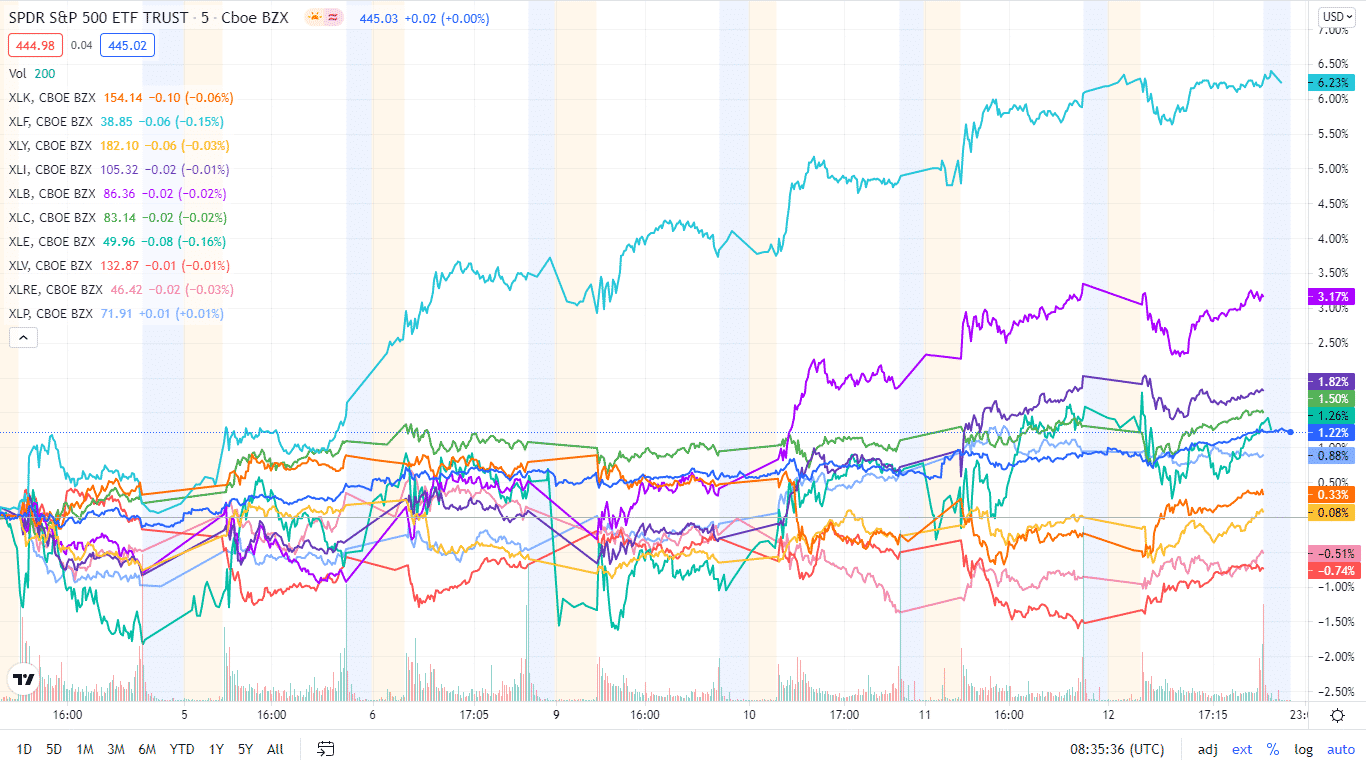
The S&P 500 individual sectors’ weekly charts
The following breakdown shows how the S&P 500 ended the week in the green by breaking down the individual sector performances using their corresponding ETFs.
The S&P 500 individual sector, weekly performance breakdown |
|||
| 1. | Materials | XLB | +2.76% with the accompanying materials select sector ETF |
| 2. | Financial Services | XLF | +2.63% with the accompanying financial select sector ETF |
| 3. | Industrial | XLI | +1.68% with the accompanying industrial select sector ETF |
| 4. | Consumer Staples | XLP | +1.25% with the accompanying consumer staples select sector ETF |
| 5. | Utilities | XLU | +0.90% with the accompanying utilities select sector ETF |
| 6. | Communication Services | XLC | +0.49% with the accompanying communication services select sector ETF |
| 7. | Energy | XLE | +0.48% with the accompanying energy select sector ETF |
| 8. | Consumer Discretionary | XLY | +0.34% with the accompanying consumer discretionary select sector ETF |
| 9. | Healthcare | XLV | -0.07% with the accompanying healthcare select sector ETF |
| 10. | Information Technology | XLK | -0.47% with the accompanying information technology select sector ETF |


Comments