Investing in dividend stocks can be a great way to create a source of passive income. However, stock selection can be challenging. Fortunately, there is an easier way to invest in dividend stocks.
What is a dividend ETF?
It is a collection of dividend-paying stocks grouped into one investment. You don’t have to worry about stock-picking or deciding when to buy or sell. With a dividend ETF, you not only make a profit on the investment itself, but you also receive a dividend payout every quarter or year.
What are the benefits of dividend ETFs?
- A fast and cost-effective way to access a diverse set of dividends
- High transparency and low costs
- One-stop solution to benefit from a variety of dividend investing strategies
- A convenient way to reduce the time spent learning about individual dividend stocks
How to calculate the dividend yield yourself?
To calculate the withdrawal amounts, the investor needs to know the dividend yield for each fund. This information can be found in regular fund reports or on Nasdaq.com
| ETFs ticker | Dividend yield(2021) | Dividend HistoryNasdaq.com | ||||||||||
| QQQ | 0.53% |
|
||||||||||
| DIA | 1.67% |
|
||||||||||
| IWM | 0.9% |
|
||||||||||
| GDX | N/A |
|
||||||||||
| XLP | N/A |
|
||||||||||
| SPY | 1.37% |
|
||||||||||
| XLF | 1.7% |
|
||||||||||
| XLE | N/A |
|
||||||||||
| IYR | 2.18% |
|
||||||||||
| MJ | N/A |
|
||||||||||
| ROBO | N/A |
|
||||||||||
Let’s count on the example. Suppose the investor owns 100 shares of a SPY ETF. The value of his assets at current prices is 100 x $408.52 = $ 40,852.
Now we can calculate the amount of dividends for the past year: $40,852 * 1.37 / 100. So the $559.67 is the number of our investor’s tips for the year.
Now let’s take a look at the TOP 3 most popular dividend ETFs.
Vanguard Dividend Appreciation ETF (VIG)
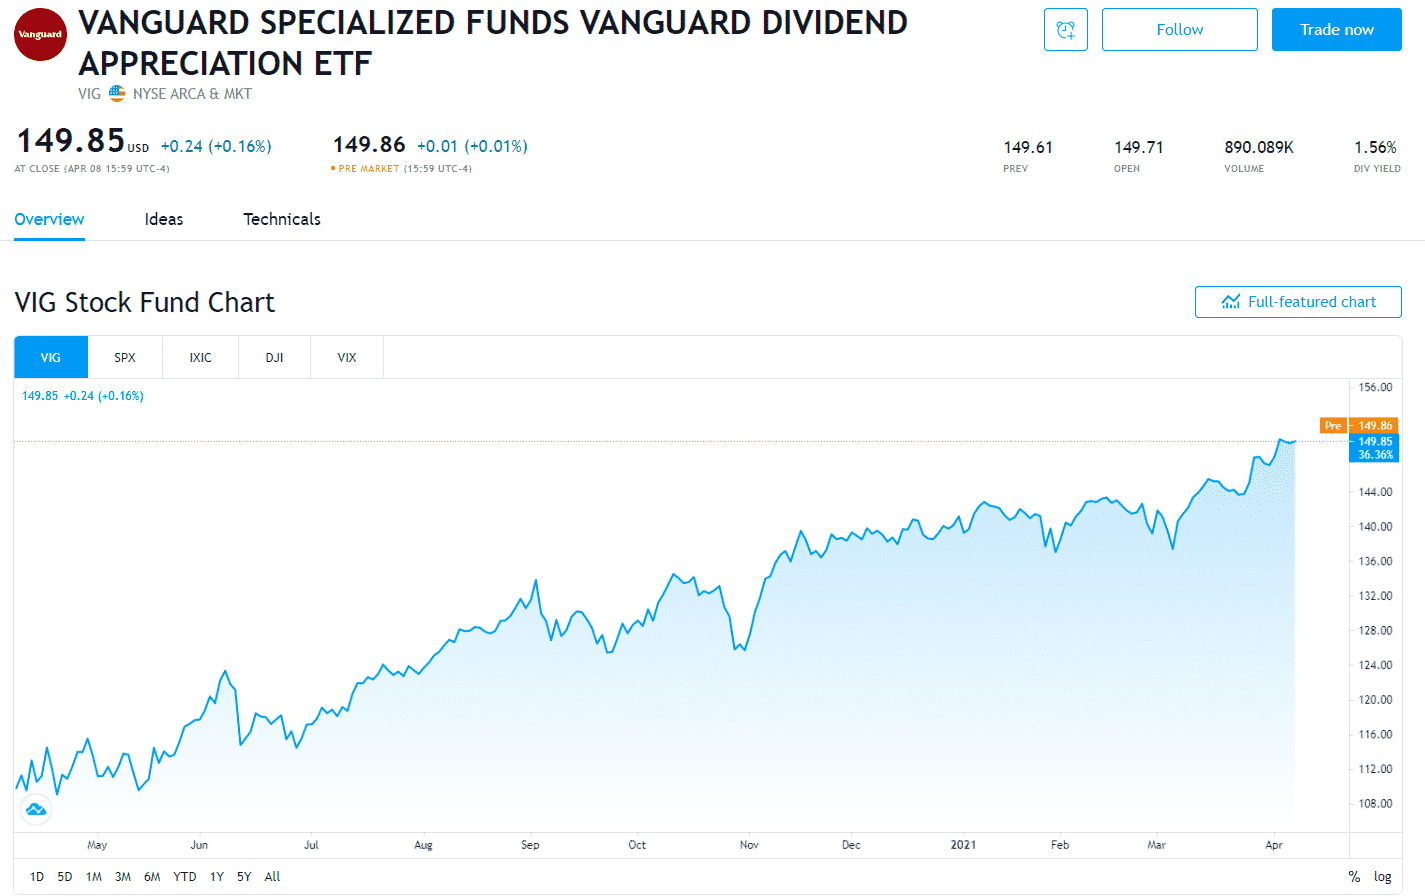
The Vanguard Dividend Appreciation ETF (NYSEMKT: VIG) tracks a sample of the NASDAQ US dividend index. Among the fund’s most prominent companies are Microsoft, Walmart, and Johnson & Johnson.
How many holdings include
It includes just over 200 holdings, the dividends of which are increasing annually.
When was founded
Since its inception in 2006, the fund has had an average return rate of about 10% per year.
What are the benefits?
If you invested just over $500 per month in this fund at an annual rate of return of 10%, you would have saved about $1 million in 30 years.
You will also receive dividends every quarter. Exactly how much bonus you receive depends on how many shares you own. But over the past year, this fund has paid between $0.50 and $0.70 per share every quarter.
ETF ProShares S&P 500 Aristocrats (NOBL)
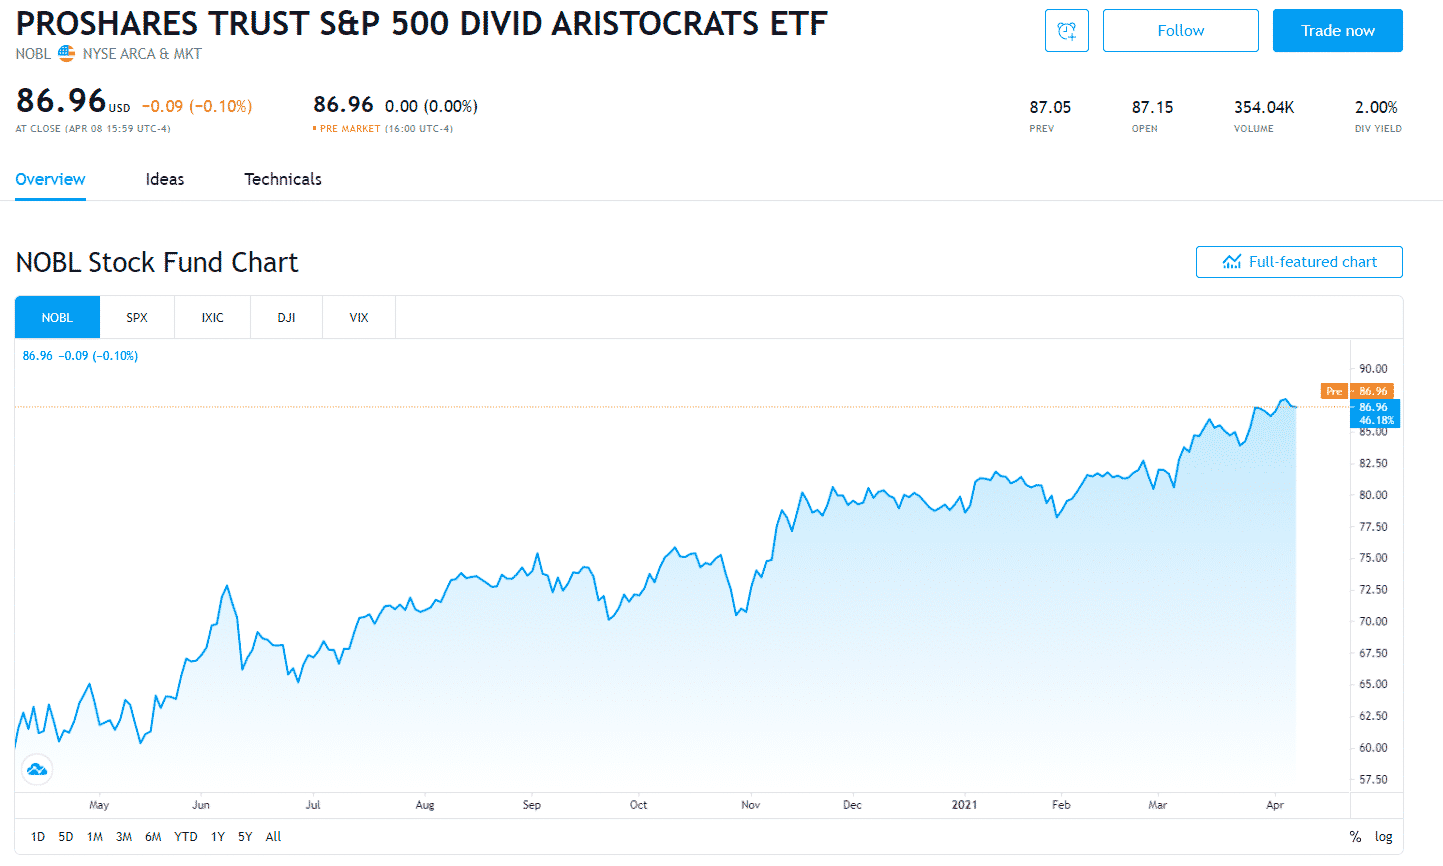
The ProShares S&P 500 Aristocrats ETF (NYSEMKT: NOBL) is a smaller and more exclusive fund. It contains only S&P 500 stocks increasing their dividends every year for at least 25 consecutive years.
How many holdings include
This fund consists of 65 holdings, so it is not as diversified as some other ETFs. However, these names are considered the best of the best when it comes to dividends.
When was founded
This fund, founded in 2013, generates an average of about 12% per annum.
What are the benefits?
To become a millionaire with this ETF, you need to invest around $350 per month and generate 12% annual returns over 30 years. The fund also pays out quarterly dividends ranging from $0.40 to $0.50 per share.
Schwab U.S. Dividend Equity ETF (SCHD)
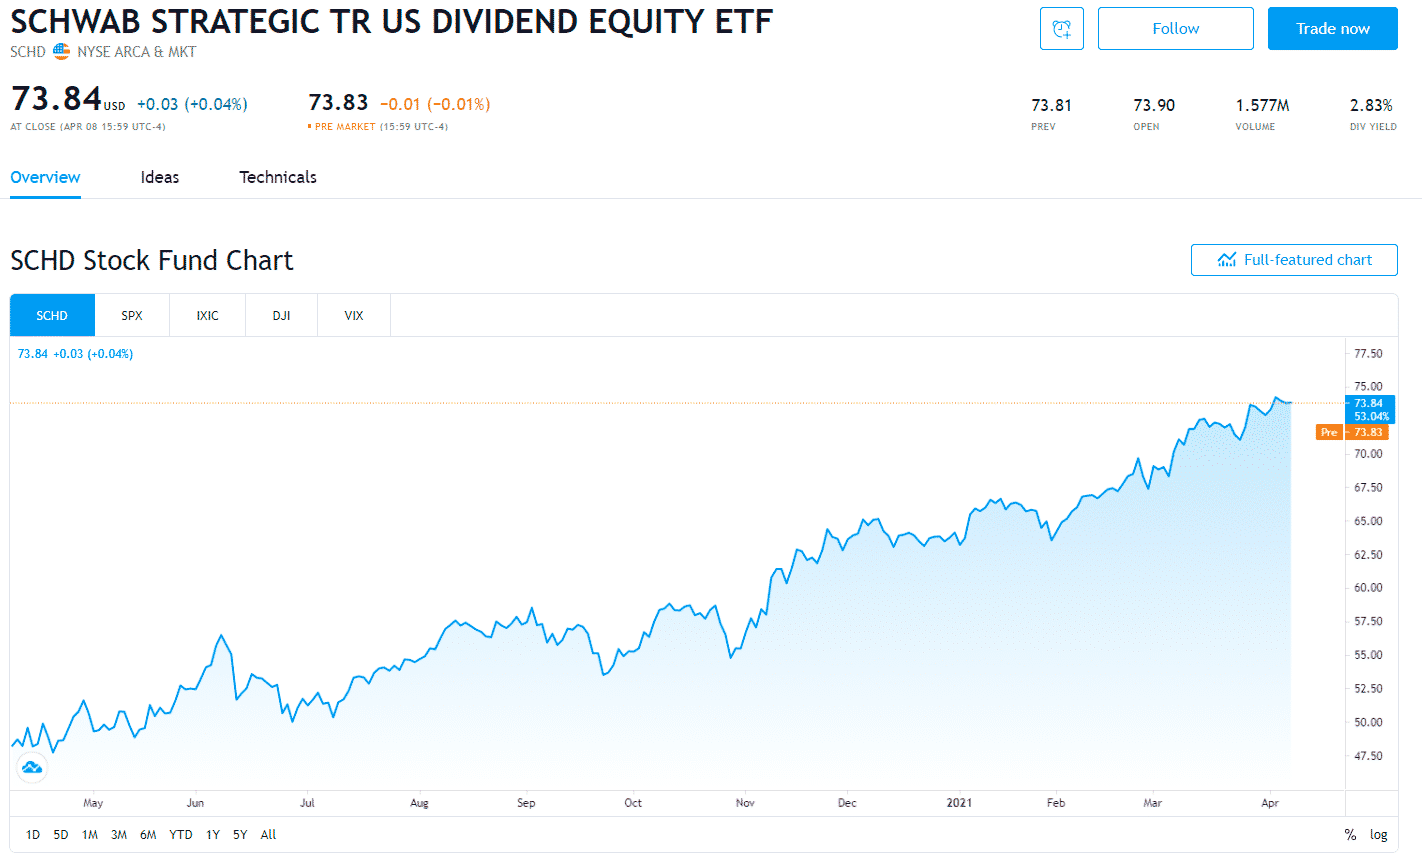
Schwab U.S. Dividend Equity ETF (NYSE MKT: SCHD) tracks the Dow Jones U.S. dividend 100.
How many holdings include
Includes just over 100 holdings with a solid track record of increasing its dividend.
When was founded
Since its inception in 2011, the fund has generated an average of about 14% per annum.
What are the benefits?
To accumulate at least $1 million, you need to invest about $250 per month and receive a 14% annual return over 30 years. Besides, the fund pays out quarterly dividends ranging from $0.40 to $0.60 per share.
Conclusion
Investing in dividend stocks can be a smart move, whether you want to build a diversified investment portfolio or create a source of passive income for the future. With these ETFs, you can generate long-term wealth with little or no effort.


Comments