
The S&P 500 seems set on eroding all the gains it made in 2021 if the markets continue spiraling downwards. The years seem to be set for a prolonged rocky start on the backdrop of accelerated rise in Fed rates.
Would SPY crumble and start a bearish run on the tailwind of faster market pricing and increasing cost on inputs?
Monday market opening gap down of 1.2% had the SPY start its trading at $459.53 was a billboard for what was to follow given the previous week’s trading pattern; gap down followed by a bearish week. From the opening price, the bears have been in control for the whole week, with the only respite being the $445.45 price level, which was last touched by prices in October and was a significant pivotal level in 2021.
Banks were first to declare their fourth-quarter earnings, close of Friday last week, and they were nowhere near inspiring. The CPI data at 7% was the highest over the previous four decades to make matters worse. As a result, investor jitters on balance between rate hikes and economic activity to spur full resurgence are on the rise resulting in the treasury yields rising six basis points to settle at a level last seen before the coronavirus pandemic.
The Santa Claus Rally at the end of December may have made investors irrational, but the economic news as of now is in favor of the bears, and they are taking full advantage. Over the week, several more sectors have seen their firms declare fourth-quarter earnings, and things are looking bleaker. In addition to rising inflation and input prices. At the same time, its wages are highly inflated, and all these factors result in a highly volatile equity market. The continued bumpy ride in the markets and the fears on how far people can stretch their paychecks amidst ever-rising prices had the Spy end the week in the red and the worst week in a while, -5.42%.
Losers of the current week
Sectors that dragged the SPY to its worst trading week in the last 12 months were:
Consumer discretionary sector at — 5.56%
Information Technology sector at — 5.1%
Financial Services sector at — 4.51%
In a week that the bears won the market fight, all the sectors were in the red, but the hardest hit were sectors hardest hit by the dismal earnings being reported over the week.
Below is a performance chart of the S&P 500 over the week and its component sectors.
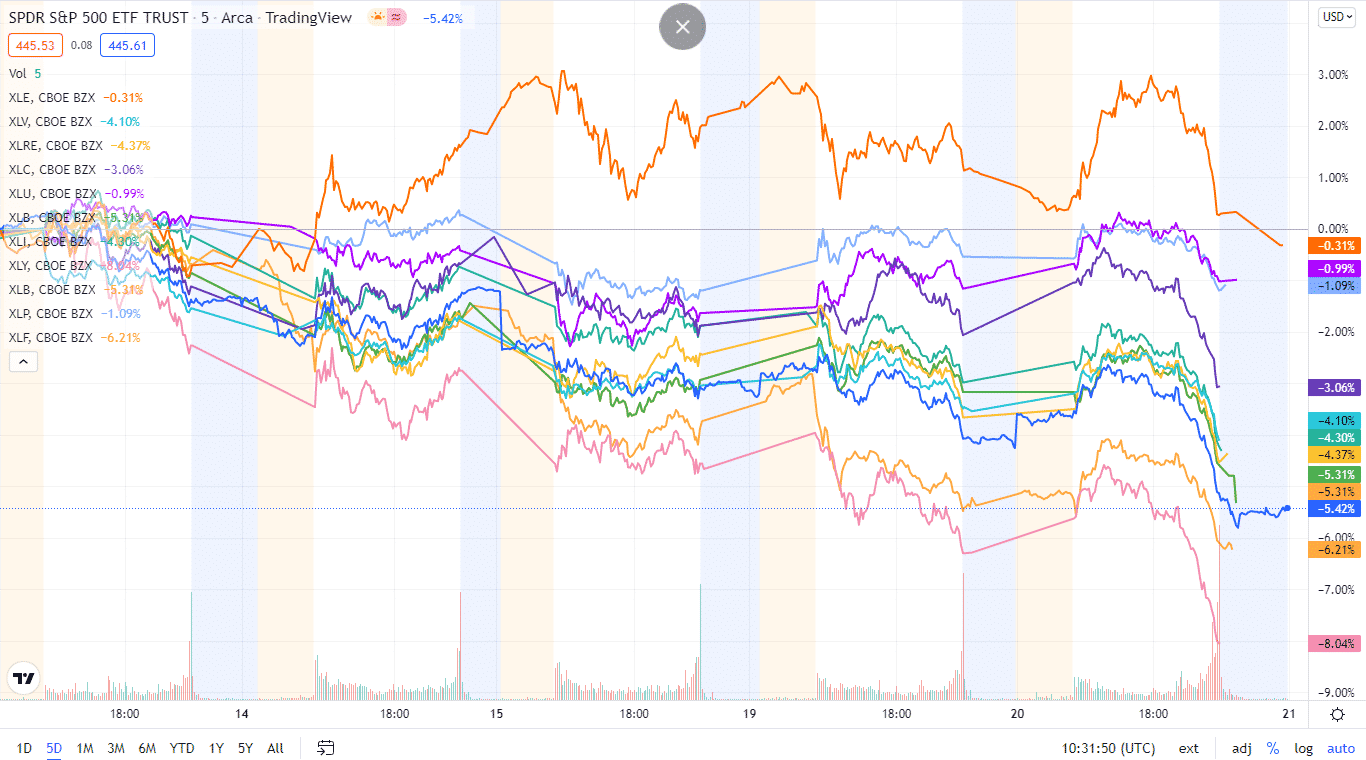
The S&P 500 individual sectors’ weekly chart
The following breakdown shows how the S&P 500 ended the week, using their corresponding ETFs. The year continues to be sour, with all the sectors losing out and finishing in the red.
The S&P 500 individual sector, weekly performance breakdown |
|||
| 1. | Utilities | XLU | -0.60% with the accompanying utilities select sector ETF |
| 2. | Energy | XLE | -1.15% with the accompanying energy select sector ETF |
| 3. | Consumer Staples | XLP | -1.54% with the accompanying consumer staples select sector ETF |
| 4. | Healthcare | XLV | -2.39% with the accompanying healthcare select sector ETF |
| 5. | Real Estate | XLRE | -2.81% with the accompanying real estate select sector ETF |
| 6. | Materials | XLB | -2.94% with the accompanying materials select sector ETF |
| 7. | Communication Services | XLC | -3.29% with the accompanying communication services select sector ETF |
| 8. | Industrial | XLI | -3.49% with the accompanying industrial select sector ETF |
| 9. | Financial Services | XLF | -4.51% with the accompanying financial select sector ETF |
| 10. | Information Technology | XLK | -5.1% with the accompanying information technology select sector ETF |
| 11. | Consumer Discretionary | XLY | -5.56% with the accompanying consumer discretionary select sector ETF |


Comments