
Since the turn of the year, the overall economic and market conditions have not been conducive for the bulls despite them hanging on and fighting tooth and nail to start SPY’s earnings season.
Would Russia’s invasion of Ukraine be the final hammer on SPY’s coffin, signaling the start of a bearish rally?
Despite a 0.4% Monday market opening gap down, it would prove to be the only highlight of the week for bullish SPY investors. Familiarly, the week’s trading started at $432.69, a gap down, and from here on, the SPY went on a bearish run that found momentary respite at the month’s pivotal level of $430.00.
With Putin-led Russia invading Ukraine, the markets reacted by sliding further down, with Thursday opening experiencing a 2.7% gap down to start the day’s trading at $410.77. The good news is that this gad down was not followed by a bearish rally like has become the norm but rather becoming a bullish rallying point to push the prices back up. However, the pivotal level at $430.00 now acting as a resistance level has proved quite a roadblock for the bulls. This wild volatility speaks to the reduced liquidity of the SPY and the possibility of it being significantly overbought.
However, liquidity is not the only indicator driving SPY’s slide. Historical data shows that this tech-heavy fund experiences bearish correction when inflation is upwards of 5%. At present, the inflation levels are at 7.5%, 40-year highs, making investors warier on how they invest, especially in the face of rate hikes. As a result, rising inflation and looming rate hikes have investors focusing more on value rather than growth, and with the SPY’s 28% weighting going to growth tech stocks, it might be in for rougher waters going forward. Couple this to Russia invading Ukraine and the resulting shockwaves across the energy sector, commodity market, currency markets, the equity markets, and significant indices experiencing a week of significant selling. The combined result is a -3.41% weekly change for the SPY to close the week trading in a correction zone.
Top gainers of the current week
Communication Services sector
In a week full of grim, the communication services sector saw significant investment inflows to finish the week in the green with a +0.36% weekly change.
Real Estate sector
With a looming war and the rising inflation, the Real Estate sector flexed its muscles as a haven investment to end the week in the green, +0.20%.
Losers of the current week
Sectors hardest hit in a week highly influenced by the Russian-Ukraine war and reduced market liquidity were:
Financial services sector at — 3.32%
Consumer Staples sector at — 3.33%
Consumer Discretionary sector at — 3.97%
The Ukraine-Russia conflict has sent shockwaves across multiple sectors, with the most brutal hit being currencies and commodities. As a result, sectors most affected by currency issues and looming blockade of the Black Sea ports are those above, resulting in them experiencing significant investment outflows.
Below is a performance chart of the S&P 500 over the week and its component sectors.
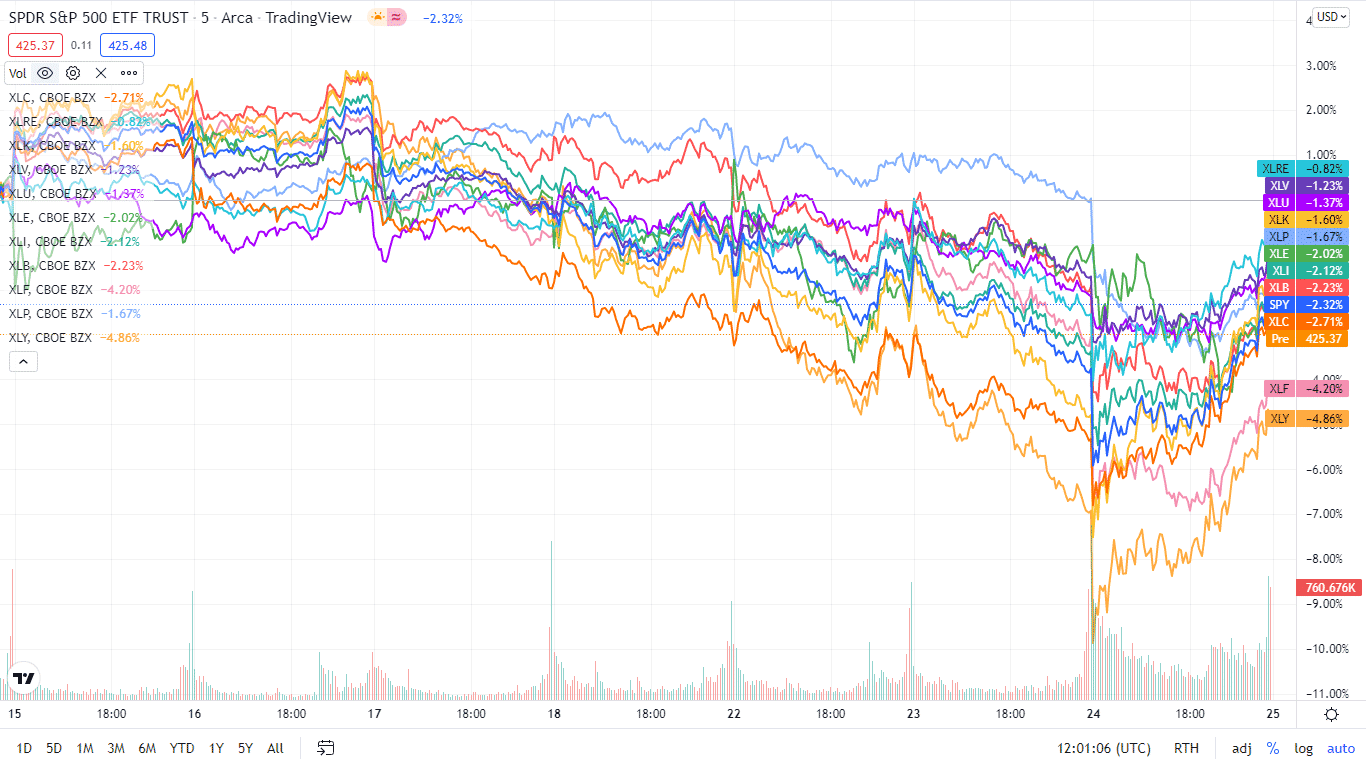
The S&P 500 individual sectors’ weekly chart
The following breakdown shows how the S&P 500 ended the week, using their corresponding ETFs. The SPY seems to be on a correct path, and with just two sectors finishing the week in the green for the second week in a row, it’s time to be highly wary of the markets.
The S&P 500 individual sector, weekly performance breakdown |
|||
| 1. | Communication Services | XLC | +0.36% with the accompanying communication services select sector ETF |
| 2. | Real Estate | XLRE | +0.20% with the accompanying real estate select sector ETF |
| 3. | Information Technology | XLK | -0.07% with the accompanying information technology select sector ETF |
| 4. | Healthcare | XLV | -0.31% with the accompanying healthcare select sector ETF |
| 5. | Utilities | XLU | -1.07% with the accompanying utilities select sector ETF |
| 6. | Energy | XLE | -1.40% with the accompanying energy select sector ETF |
| 7. | Industrial | XLI | -1.58% with the accompanying industrial select sector ETF |
| 8. | Materials | XLB | -2.98% with the accompanying materials select sector ETF |
| 9. | Financial Services | XLF | -3.32% with the accompanying financial select sector ETF |
| 10. | Consumer Staples | XLP | -3.33% with the accompanying consumer staples select sector ETF |
| 11. | Consumer Discretionary | XLY | -3.97% with the accompanying consumer discretionary select sector ETF |


Comments