
After another excellent week for the SPY, the new week was awaited with bated breath.
Would the SPY tap into its reserve and result in another bullish week, or was the 3-week bullish run market correction before the bear growls?
Monday’s market opening price of $452.56 continued where the markets had closed on Friday, at $452.22, the same price level. This price was just below the yearly pivotal level, resulting in a cat and mouse game between bears and bulls as the market decided to go up or down. With prices largely sideways on Monday, Tuesday saw prices start trading with a 1.3% gap up, beginning a bullish rally at the year’s pivotal level at $460.01.
Despite the Ukraine-Russia war, US equities continue to enjoy their safe-haven status and the markets their newfound rebound run. However, the 2-year treasury yields overtaking the 10-year treasury yields pointed to a recession. Historically, yield inversions have been an indicator of the looming recession. It was the single most reason for investor jitters over the week and the reason for the SPY’s newfound bullish legs to waver.
In the meantime, the second quarter is kicking off, and all eyes are on the job report, with substantial numbers expected to allow the FED to raise rates further to try and curb inflation. Despite all these, stocks held on at the close of the first quarter to finish the week at +0.12%.
Top gainers of the current week
Real Estate sector
With fears of inflation on the backdrop of inverted yields, investors went back to more traditional inflation-protected assets, with the real estate sector benefitting the most to close the week with a +2.36% change.
Utilities sector
The utilities sector, a traditionally defensive sector, followed in the footsteps of the real estate sector to close the week with a +2.22% change.
Consumer Staples sector
Given its inflexible demand, the consumer staples sector experienced inflows in the face of looming recession to buoy itself to the green with a +1.06% weekly change.
Losers of the current week
Materials Sector at — 1.38%
Financial Services sector at — 3.07%
Energy Sector at — 3.23
With the looming recession and Biden confirming the consideration for releasing oil reserves, the worst-hit sectors by investor jitters were as above.
Below is a performance chart of the SP 500 over the week and its component sectors.
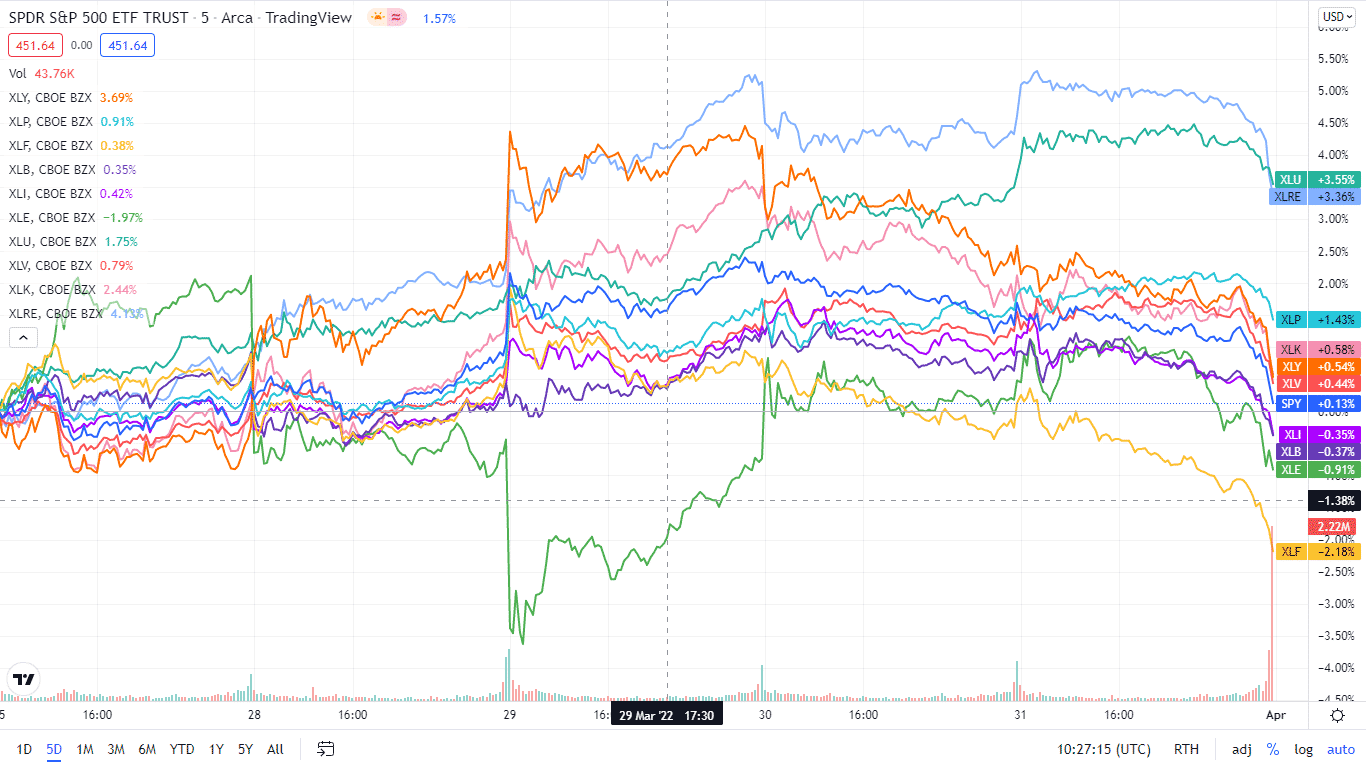
The S&P 500 individual sectors’ weekly chart
The following breakdown shows how the S&P 500 ended the week using its corresponding ETFs. The SPY was largely sideways, balancing sectors finishing in the red and those in the green.
| The S&P 500 individual sector, weekly performance breakdown | |||
| 1. | Real Estate | XLRE | +2.36% with the accompanying real estate select sector ETF |
| 2. | Utilities | XLU | +2.22% with the accompanying utilities select sector ETF |
| 3. | Consumer Staples | XLP | +1.06% with the accompanying consumer staples select sector ETF |
| 4. | Consumer Discretionary | XLY | +0.68% with the accompanying consumer discretionary select sector ETF |
| 5. | Healthcare | XLV | +0.32% with the accompanying healthcare select sector ETF |
| 6. | Information Technology | XLK | +0.29% with the accompanying information technology select sector ETF |
| 7. | Industrial | XLI | -0.80% with the accompanying industrial select sector ETF |
| 8. | Communication Services | XLC | -0.93% with the accompanying communication services select sector ETF |
| 9. | Materials | XLB | -1.38% with the accompanying materials select sector ETF |
| 10. | Financial Services | XLF | -3.07% with the accompanying financial select sector ETF |
| 11. | Energy | XLE | -3.23% with the accompanying energy select sector ETF |


Comments