
The good news is, the overall SPY trend is bullish. The bad news is, the SPY short-term trend is what we have experienced week in week out, sideways.
Given the tendency of the SPY to open the week with a gap down, investors were not surprised to see it open the week at $438.81. This opening price represented a 0.1% gap compared to the 19th to 23rd July week, close to $439.41. In keeping with its trend over the whole month, prices plunged to test the monthly pivot point of $435.03-$435.97, which acted as a launchpad for a bullish run.
Will the S&P 500 close the month in the green or red?
After testing the weekly pivot point, the SPY rallied upwards with the bulls in control to set a new high for the month at $441.73. However, it lost its steam to form a bearish trend that had it trading at the $438.86-$439.79 range on Friday.
Investors seem to have adopted a wait-and-see approach to the SPY, waiting to see if the Fed will stick to its guns and leave policies unchanged. The FOMC meeting had Powel echoing the sentiments made in June that there is still no need to tapering policies despite the inflation rate and jobless claims being within the required levels.
Finishing the week at +0.71% is quite the achievement given all the news, events, and activities surrounding the SPY and economy at large over the week.
The individual sectors forming the S&P 500 continued their dance, with the usual culprits at the top of the table being dislodged to make room for industries considered to be more aggressive investment-wise.
Gainers of the current week
Energy sector
The energy sector is back at the top of the table, fueled by the imminent shortage in US crude oil reserves, recording a weekly change of +3.40%.
Materials sector
Inflation rates seem to be having the desired effect, with demand for commodities on the rise and production capacity accelerating towards a return to normalcy. Investors have taken note of this investing in the materials sector to move it to the green, +2.37%.
Financial services sector
The financial services sector hitchhiked a ride on the surge of the materials sector by financing their activities to go back in the green. As more firms resume economic normalcy, they will need the financial services sector money muscle to regain the necessary production capacities to satisfy the inflation-led demand. The sector recorded a +1.45% weekly change.
Losers of the current week
Sectors hard hit by the turmoil of the Chinese stock market and a relatively below-average forecast for Q3 are:
Industrial sector at -0.07%
Communication services sector at -0.53%
Information technology sector at -0.65%
With so much reliance on the Asia-pacific region for technology for the information and communications sector and labor for the industrial sector, it comes as no surprise that these three sectors are in the red.
Here is a chart of the eleven sectors’ weekly performance and how they have fared against the S&P 500.
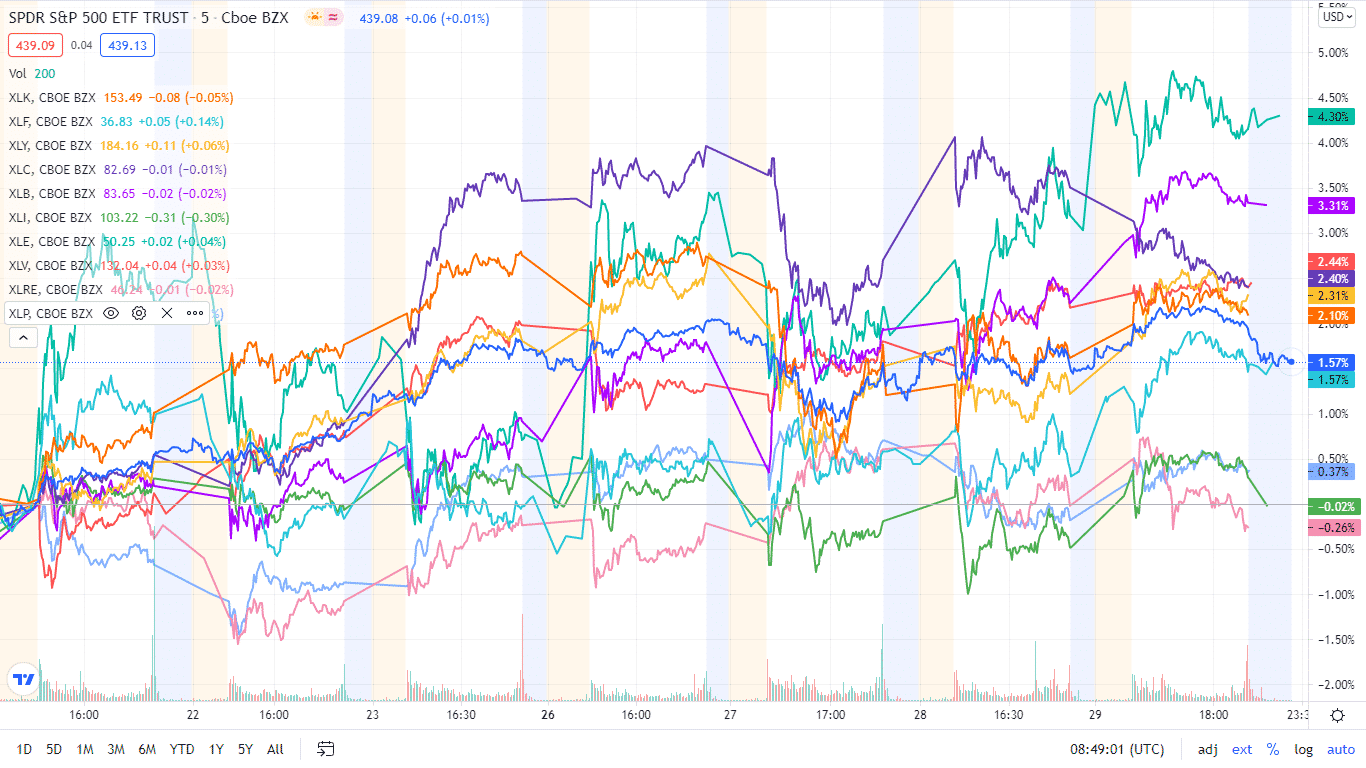
The S&P 500 weekly individual sector charts
The overall performance of the SPY saw it close the week and month in the green. Below is a breakdown of the S&P 500 underlying sectors and their performance over the week, from 26th to 30th July week, using their corresponding ETFs.
| S&P 500 industry sector weekly performance breakdown | |||
| 1. | Energy | XLE | +3.40% with the accompanying energy select sector ETF |
| 2. | Materials | XLB | +2.37% with the accompanying materials select sector ETF |
| 3. | Financial Services | XLF | +1.45% with the accompanying financial select sector ETF |
| 4. | Utilities | XLU | +1.21% with the accompanying utilities select sector ETF |
| 5. | Healthcare | XLV | +0.38% with the accompanying healthcare select sector ETF |
| 6. | Consumer Discretionary | XLY | +0.21% with the accompanying consumer discretionary select sector ETF |
| 7. | Consumer Staples | XLP | +0.10% with the accompanying consumer staples select sector ETF |
| 8. | Real Estate | XLRE | -0.04% with the accompanying real estate select sector ETF |
| 9. | Industrial | XLI | -0.07% with the accompanying industrial select sector ETF |
| 10. | Communication Services | XLC | -0.53% with the accompanying communication services select sector ETF |
| 11. | Information Technology | XLK | -0.65% with the accompanying information technology select sector ETF |


Comments