
The previous week, 23rd to 27th August, saw a bullish run coupled to a sideways market that recorrected the last week’s bear, giving investors some much-needed breathing space and hope that the economy is not slowing down. The SPY would go on to close the week at $450.15, a new monthly high and in the green for the week.
Would the new week see the SPY recollection pick up the pace, or would it slide downwards?
Unsure of the SPY Monday morning norm of a gap down happening since the previous week was a gap up, investors watched the market keenly to see either a continuation of the gap downtrend or confirmation of the new gap uptrend. Bullish investors were in luck as the SPY opened at $450.98, a 0.2% gap up.
The bullish traders didn’t look back after Monday’s opening gap up, dominating the markets for the next two days to break the August monthly high of $450.15 and set a new one at $452.85. This level, however, proved a tough nut to crack with the pace of the SPY enduring continued assault from late Tuesday only to crack on Thursday after the weekly jobless claims report came in better than expected, 340K, the lowest in the pandemic era. There were also an additional 750 thousand jobs in August, to the July edition of 943 thousand, showing that the economy is still growing. Analysts also expect the unemployment rate to improve to 5.2%.
The good news resulted in another 0.2% gap up, to set yet another yearly high of $453.69, before losing momentum and going down to trade in the$451.94 to $453.20 range.
Between the individual sectors making up the S&P 500, a complete shift in the chess game that has been ongoing was experienced.
Gainers of the current week
Real Estate sector
US housing prices continue to soar across the country, which propelled the real estate sector to the pole position in the chess game afoot between the individual sectors. It led to the pull of the weekly positive S&P 500 change with +3.95%.
Utilities sector
Despite the more than favorable economic data, Powell’s statement that the FED tapering might come as early as November. The result is an inflow of investments into the safe-haven sector, such as the utility sector resulting in a +2.20% weekly change.
Healthcare sector
Another go-to sector in times of economic uncertainty, the Healthcare sector, shook off the news of MU coronavirus news to close the week at +1.59%.
Losers of the current week
Sectors that took the brunt of the economic good news were:
Material sector at — 0.17%
Energy sector at — 0.92%
Financial Services sector at — 1.88%
Historically, these three sectors are aggressive investment vehicles and the go-to sectors in bullish markets. However, the uncertainties surrounding FED tapering seem to have taken their toll this week, resulting in their decline. In addition, Biden is on OPECs neck for increased crude oil output, resulting in lower prices.
Below is a performance chart of the S&P 500 over the week and its component sectors.
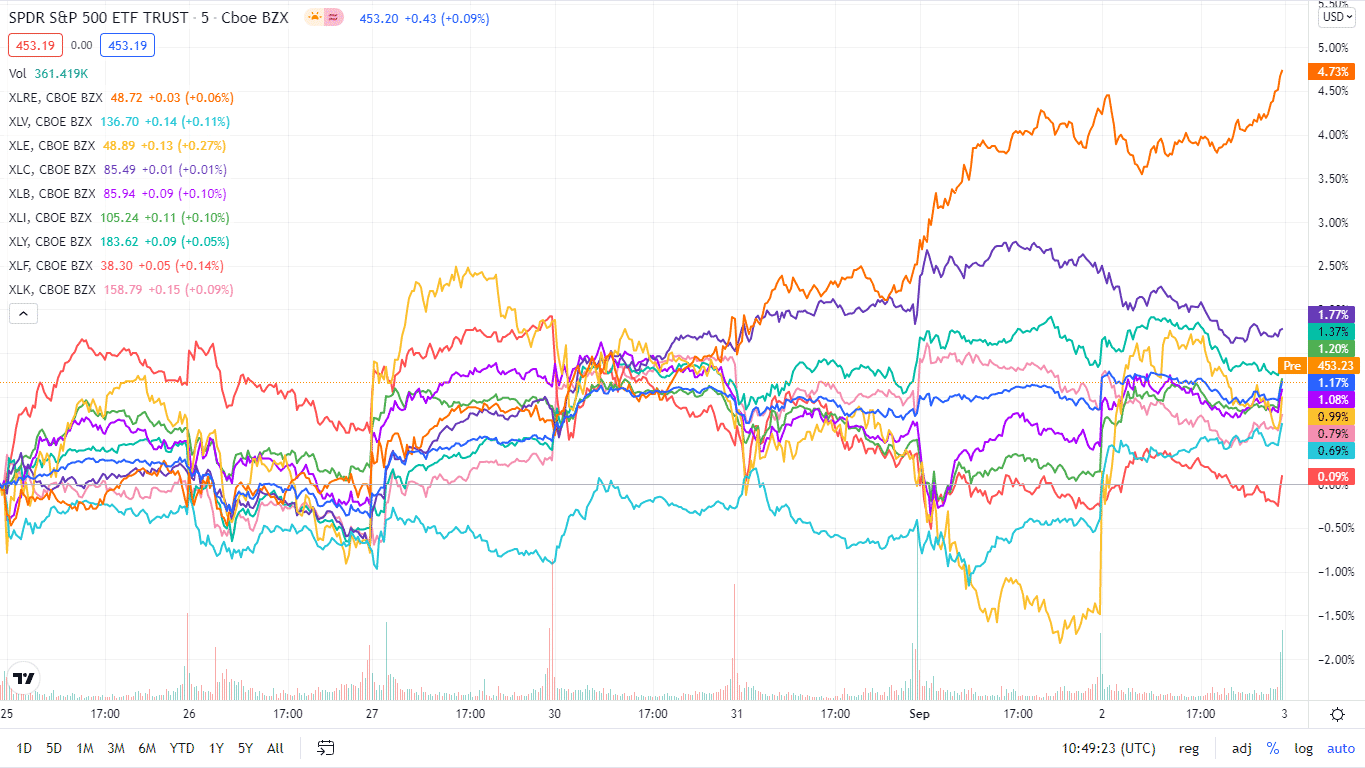
The S&P 500 individual sectors’ weekly chart
The following breakdown shows how the S&P 500 ended the week in the green by breaking down the individual sector performances using their corresponding ETFs.
| The S&P 500 individual sector, weekly performance breakdown | |||
| 1. | Real Estate | XLRE | +3.95% with the accompanying real estate select sector ETF |
| 2. | Utilities | XLU | +2.20% with the accompanying utilities select sector ETF |
| 3 | Healthcare | XLV | +1.59% with the accompanying healthcare select sector ETF |
| 4. | Consumer Staples | XLP | +1.58% with the accompanying consumer staples select sector ETF |
| 5. | Consumer Discretionary | XLY | +1.2% with the accompanying consumer discretionary select sector ETF |
| 6. | Communication Services | XLC | +0.85% with the accompanying communication services select sector ETF |
| 7. | Information Technology | XLK | +0.49% with the accompanying information technology select sector ETF |
| 8. | Industrial | XLI | +0.21% with the accompanying industrial select sector ETF |
| 9. | Materials | XLB | -0.17% with the accompanying materials select sector ETF |
| 10. | Energy | XLE | -0.92% with the accompanying energy select sector ETF |
| 11. | Financial Services | XLF | -1.88% with the accompanying financial select sector ETF |


Comments