
Q3 earnings season seems to have kicked off given SPY’s record weekly changes in the past two weeks with minor fluctuations in between.
Would SPY keep on track in this phenomenal earnings season?
SPY Monday opening price was a sight for sore eyes for those bullish on the SPY. The norm has been Monday’s opening gap down, but this would not be the case for the 25th October to 29th October trading week. SPY opened with an urgency to continue where it had left of the previous week, a bullish surge resulting in +1.60% weekly change, with a 0.3% gap up to start trading at $453.65.
This bullish start to a trading week was, however, short-lived. The bears took charge of the market on Monday afternoon, pushing prices down to the 452.95 level, which had been the previous week’s resistance level. True to what we have seen so far this year, investor sentiments, despite most economic experts declaring inflation is no longer transitory but out of control, seem to be bullish.
As a result, the SPY flipped this level into support and started a rampaging bullish run that lasted up to Tuesday to set a new weekly resistance level at $458.35. Despite the Refinitiv Lipper report showing that the investment market was still bullish with the most significant weekly fund asset purchases since February, $61.9 billion, SPY could not break this resistance level.
The result since hitting this resistance level has been a sideways market with constant testing of the level, so its integrity holds.
In addition to inflation levels that seem out of control, but FED officials insist it is within limits, supply chain disruptions coupled with labor shortages in the wake of economic reopening result in high costs on inputs and high price consumables. However, unlike the previous week, some SPY sectors have struggled this week, resulting in a very marginal weekly change for the SPY compared to the last three weeks, +0.68%.
Top gainers of the current week
Consumer Discretionary sector
Supply chain bottlenecks resulting in increased prices of products are still fuelling the consumer discretionary bullish rampage. This sector was the top gainer for the week to close at +4.01% weekly change.
Information Technology sector
Most tech companies have reported better than expected quarterly revenues resulting in an inflow of funds into the sector resulting in a +1.53% weekly change.
Real Estate sector
Despite all investor sentiments being bullish, the markets are still cognizant of the rising inflation, currently at a 30 year high, resulting in inflows into inflation-protected assets with real estate pulling ahead of the pack +1.51% weekly change.
Losers of the current week
Sectors that slowed down the marauding SPY bullish run were:
Energy sector at — 0.10%
Industrial sector at — 0.28%
Financial Services sector at — 0.47%
With the middle east getting into the zero-emissions bandwagon and Bidens’ ambitious infrastructure bill still in the house, the Energy sector continues to experience investment outflows. The industrial sector’s negative change for the week is still attributable to the rising cost of inputs and shortage of labor slowing down this sector’s recovery.
Coupled with the industrial sector is the financial services sector, which experienced some investment outflows to close the week in the red with a slowing down of the economy.
Below is a performance chart of the S&P 500 over the week and its component sectors.
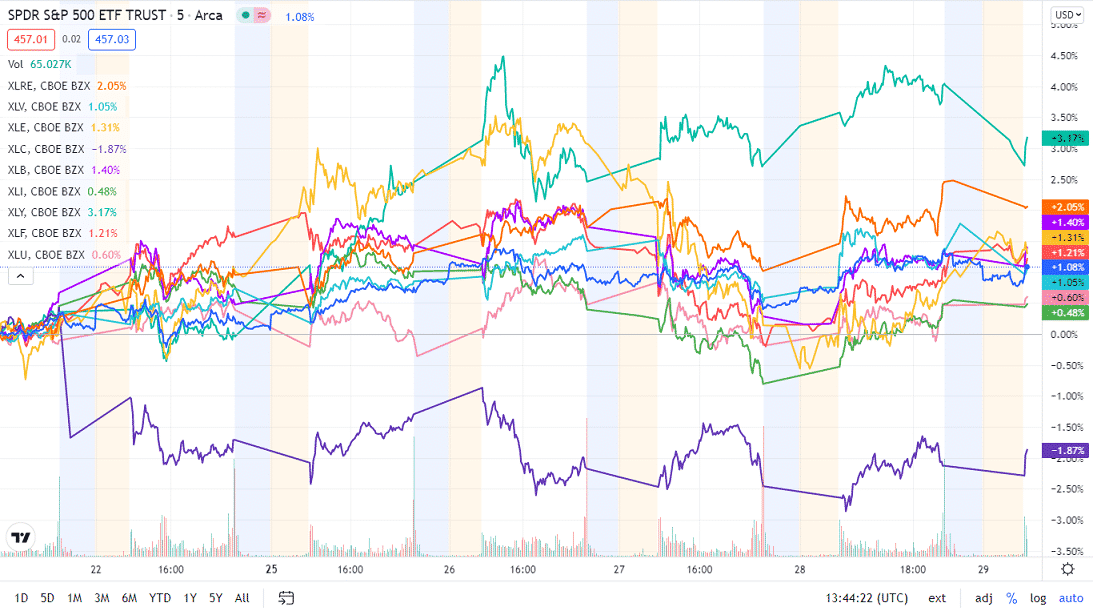
The S&P 500 individual sectors’ weekly chart
The following breakdown shows how the S&P 500 ended the week in the green by breaking down the individual sector performances using their corresponding ETFs.
The S&P 500 individual sector, weekly performance breakdown |
|||
| 1. | Consumer Discretionary | XLY | +4.01% with the accompanying consumer discretionary select sector ETF |
| 2. | Information Technology | XLK | +1.53% with the accompanying information technology select sector ETF |
| 3. | Real Estate | XLRE | +1.51% with the accompanying real estate select sector ETF |
| 4. | Communication Services | XLC | +1.19% with the accompanying communication services select sector ETF |
| 5. | Materials | XLB | +0.83% with the accompanying materials select sector ETF |
| 6. | Healthcare | XLV | +0.67% with the accompanying healthcare select sector ETF |
| 7. | Consumer Staples | XLP | +0.17% with the accompanying consumer staples select sector ETF |
| 8. | Utilities | XLU | +0.10% with the accompanying utilities select sector ETF |
| 9. | Energy | XLE | -0.10% with the accompanying energy select sector ETF |
| 10. | Industrial | XLI | -0.28% with the accompanying industrial select sector ETF |
| 11. | Financial Services | XLF | -0.47% with the accompanying financial select sector ETF |


Comments