
After a third straight week of losses that ended on a positive note with a better-than-expected economic outlook and FED’s announcement of early tapering and interest rate hike, the close of September looked like a ray of sunshine for the SPY.
Was the SPY finally over the September Doldrums and back to its record-breaking streak?
Come Monday morning and the expected ray of sunshine came down crashing. Opening prices mirror the previous three weeks exhibiting a 0.7% gap down to the week’s trading at $439.13.
The FED statement that there is still a mismatch between inflation and the employment market had the bond markets gaining as the week started resulting in the bearish trend of the equities market. As a result, after the initial gap-down, the SPY began a downward trend breaking past the previous week’s pivot point to rest on the August resistance turned support of $433.84.
The SPY would trade sideways from 27th September to 29th September, with investors waiting on the Thursday economic calendar to signal either positive or declines, as well as voting on government funding.
The Senate voted to keep the lights on for government agencies approving a supplementary budget to 3rd December as they develop a holistic funding plan.
On the other hand, Treasury Secretary Janet Yellen has called on the Senate to eliminate the debt ceiling mechanism and anticipates that at the current rate, the well might run dry by mid-October. This announcement sparked market volatility, resulting in the SPY sliding further down to trade in the $429.13-$430.78 regions, closing the week in the red again, -2.78%.
The September decline of -5.02% has the SPY in the worst position since the Covid-19 pandemic.
Among the individual S&P 500 sectors, the game of musical chairs is still afoot, despite 91% of the sectors closing the week in the red.
Gainer of the current week
Energy sector
This sector maintained its top spot for the 3rd week running. It was also the only sector to close the week in the green, +2.41%, attributable to the increasing crude oil and natural gas prices.
Losers of the current week
Sectors that took the biggest blow of the September doldrums was:
Information Technology sector at — 4.71%
Healthcare sector at — 3.61%
Communication Services sector at — 3.51%
With the close of quarter three and investor jitters fueled by fear of the equity market reaction to the removal of FED support, selloffs being experienced are a reminder of the influence of monetary policies on the equity market. The worst affected sectors seem to be the information technology, healthcare sector, and communication services sector.
Below is a performance chart of the S&P 500 over the week and its component sectors.
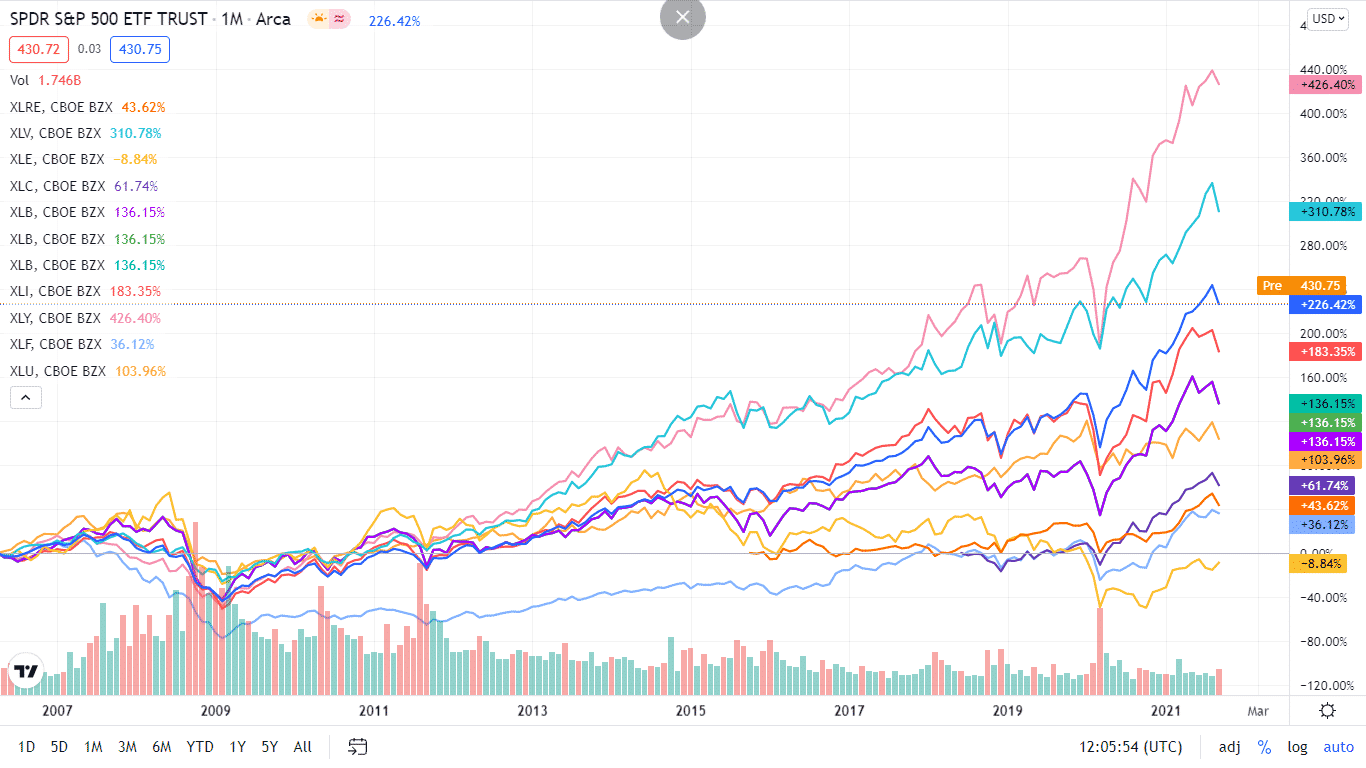
The S&P 500 individual sectors’ weekly chart
The following breakdown shows how the S&P 500 ended the week in the green by breaking down the individual sector performances using their corresponding ETFs.
The S&P 500 individual sector, weekly performance breakdown |
|||
| 1. | Energy | XLE | +2.41% with the accompanying energy select sector ETF |
| 2. | Financial Services | XLF | -1.85% with the accompanying financial select sector ETF |
| 3. | Utilities | XLU | -1.96% with the accompanying utilities select sector ETF |
| 4. | Materials | XLB | -2.47% with the accompanying materials select sector ETF |
| 5. | Consumer Staples | XLP | -2.89% with the accompanying consumer staples select sector ETF |
| 6. | Consumer Discretionary | XLY | -3.03% with the accompanying consumer discretionary select sector ETF |
| 7. | Industrial | XLI | -3.06% with the accompanying industrial select sector ETF |
| 8. | Real Estate | XLRE | -3.24% with the accompanying real estate select sector ETF |
| 9. | Communication Services | XLC | -3.51% with the accompanying communication services select sector ETF |
| 10. | Healthcare | XLV | -3.61% with the accompanying healthcare select sector ETF |
| 11. | Information Technology | XLK | -4.71% with the accompanying information technology select sector ETF |


Comments