
The first week of November finished on a high, riding on the better-than-expected jobs report, 531K job additions in October compared to 312K in September.
Would the SPY bullish run continue?
Following the trend of market gap up, Monday morning market opening welcomed investors with a 0.3% gap up to start the SPY trading at $469.69. It was the sign investors were waiting for to continue their earnings season; unfortunately, this bullish move would be short-lived. Prices hit a new high at the $470.67 level, which would prove a formidable resistance level and the best news for the bulls for the rest of the week.
Supply chain bottlenecks, supply shortages, and rising inflation seem to have finally caught up with the earnings season. As a result, prices plummeted from the weekly resistance level taking a rest on the $466.92 level. This level would hold for a day and a half before finally giving in and prices sliding further to $462.13.
The booster shots have been shown to reduce hospitalization and death rates by upwards of 89%, laying the ground for reopening service sectors-airlines and cruise ships. However, despite this good news, the ageing workforce, request for better pay in the post-pandemic world and flexible working arrangements are still leading to labor shortages slowing down economic recovery.
In addition, the CPI figures of 6.2% show that inflation is past the transitory state, the fastest rate since 1990 and a fifth straight month of it being higher than 5%. The result is the extra cost to consumers, further hurting the populace pocketbook meaning reduced disposable income for investment.
These factors resulted in the SPY sliding to the red to trade late Friday with a -1.21%. As such, it comes as no surprise that only three of the SPY sectors were in the green for the week, with all the rest being in the red.
Top gainers of the current week
Materials sector
With reduced supply and increased demand, the price of products goes up. With the holiday season drawing nearer and transportation bottlenecks and supply shortages persisting, those in the materials sector with the ability to meet demand are reaping huge profits. The effect is the materials sector gaining the most this week to close at a whopping +1.79%.
Health care sector
Several pharmaceutical companies have penned down their first profitable deals for the Covid-19 vaccines. In addition, the 89% reduction in covid-related hospitalization and death cases has investments flowing into the health care sector. As a result, it posted positive strides for the week to close at +0.19%.
Financial service sector
With Powel and the FED still insisting on the start of tapering in November, the financial services sector finally tasted some inflows to close the week at +0.08%.
Losers of the current week
Eight sectors dragged the SPY to the red this week but the worst hit were:
Energy sector at — 1.42%
Communication Services sector at — 2.13%
Consumer Discretionary sector at — 3.62%
Despite the bipartisan infrastructure bill’s passing, the global drive for shifting from fossil fuels seems to grip the energy sector, resulting in it remaining in the red for a fifth straight week.
On the other hand, the communication sector suffered on the back of Biden signing legislation that denies licenses for new equipment to ZTE Corp and Huawei technologies-yet they are among the top global firms in the sector.
The consumer discretionary sector experienced the worst slide for the week, showing that supply chain bottlenecks and labor shortages have caught up to the sector’s earnings season.
Below is a performance chart of the S&P 500 over the week and its component sectors.
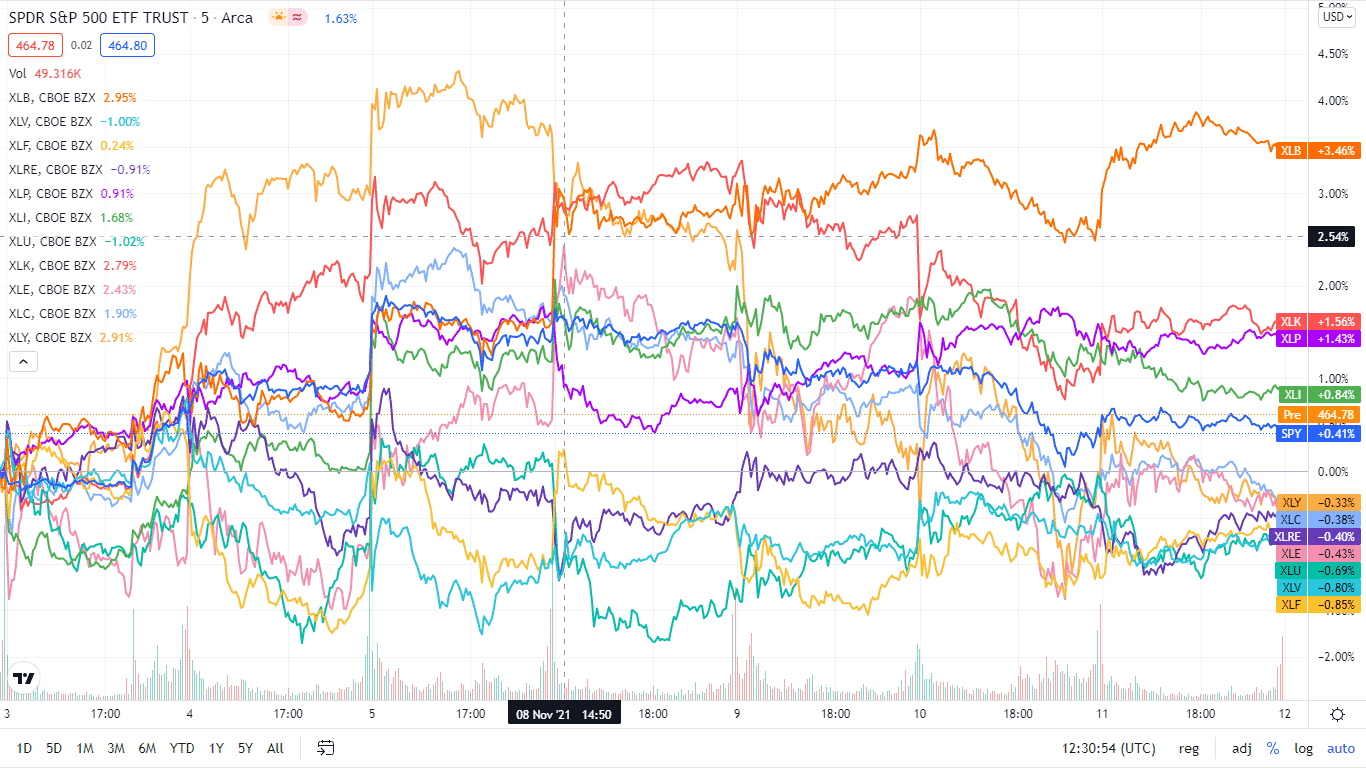
The S&P 500 individual sectors’ weekly chart
The following breakdown shows how the S&P 500 ended the week in the red by breaking down the individual sector performances using their corresponding ETFs
The S&P 500 individual sector, weekly performance breakdown |
|||
| 1. | Materials | XLB | +1.79% with the accompanying materials select sector ETF |
| 2. | Healthcare | XLV | +0.19% with the accompanying healthcare select sector ETF |
| 3. | Financial Services | XLF | +0.08% with the accompanying financial select sector ETF |
| 4. | Real Estate | XLRE | -0.11% with the accompanying real estate select sector ETF |
| 5. | Consumer Staples | XLP | -0.25% with the accompanying consumer staples select sector ETF |
| 6. | Industrial | XLI | -0.40% with the accompanying industrial select sector ETF |
| 7. | Utilities | XLU | -0.92% with the accompanying utilities select sector ETF |
| 8. | Information Technology | XLK | -1.01% with the accompanying information technology select sector ETF |
| 9. | Energy | XLE | -1.42% with the accompanying energy select sector ETF |
| 10. | Communication Services | XLC | -2.13% with the accompanying communication services select sector ETF |
| 11 | Consumer Discretionary | XLY | -3.62% with the accompanying consumer discretionary select sector ETF |


Comments