
A third straight week in the red and SPY bullish investors are wondering if this is the week that it hits correction levels.
Would investor fears further slide to correction levels materialize, or would the SPY rally recover some lost ground?
Monday market opening did not experience a gap down, nor a gap up like it has come to be expected on the SPY. It picked up where it had closed the previous week’s trading to start at $436.92. Bears took charge of the market from the opening price to the $421.53 pivotal level of 2021. This proved a significant pivotal level of 2021, sparking frenzied buying of the dip with market participants hoping for a re-correction. It meant that the second day of trading in the week saw the SPY finish in the green despite a 4% bearish slide since Monday’s opening. However, ending the previous week with prices having crossed over their 200-day moving average to trade on its downside meant that the bears were still in control.
Inflation is still rising, and with Powell yet to say how the FED will balance between rate hikes and encouraging a fast-paced economic resurgence, investors are in a conundrum. Weaker economic projections give investors some respite that the rate hike might not be as accelerated as Powell had earlier stated. Still, they are also on the lookout for its bond-buying program policy.
Coupled with increasing supply challenges due to China’s Zero Covid policy that several other nations might adopt and a looming energy crisis due to the Ukraine Russia border. The markets are still bound to experience more volatility.
In the meantime, the 200-day moving average proved a thorn on the SPY’s foot, and it is still trading below it, meaning it was a largely sideways week, though bearishly inclined.
Top gainers of the current week
Energy sector
The energy sector continued to take advantage of rising prices to take the bulk of investor inflows and close the week at +5.65%
Financial Services sector
Less than desirable 2021 last quarter earnings have organizations looking for capital to ramp up operations to full capacity and recover in the first quarter. As a result, the financial services sector also finished in the green at +0.05%.
Losers of the current week
Sectors had hit by the market volatility and uncertainty were:
Utilities sector at — 2.52%
Consumer discretionary sector at — 3.19%
Real Estate at — 3.48%
In a week of few positives, the hardest-hit sectors by the continued investor uncertainties were as above.
Below is a performance chart of the S&P 500 over the week and its component sectors.
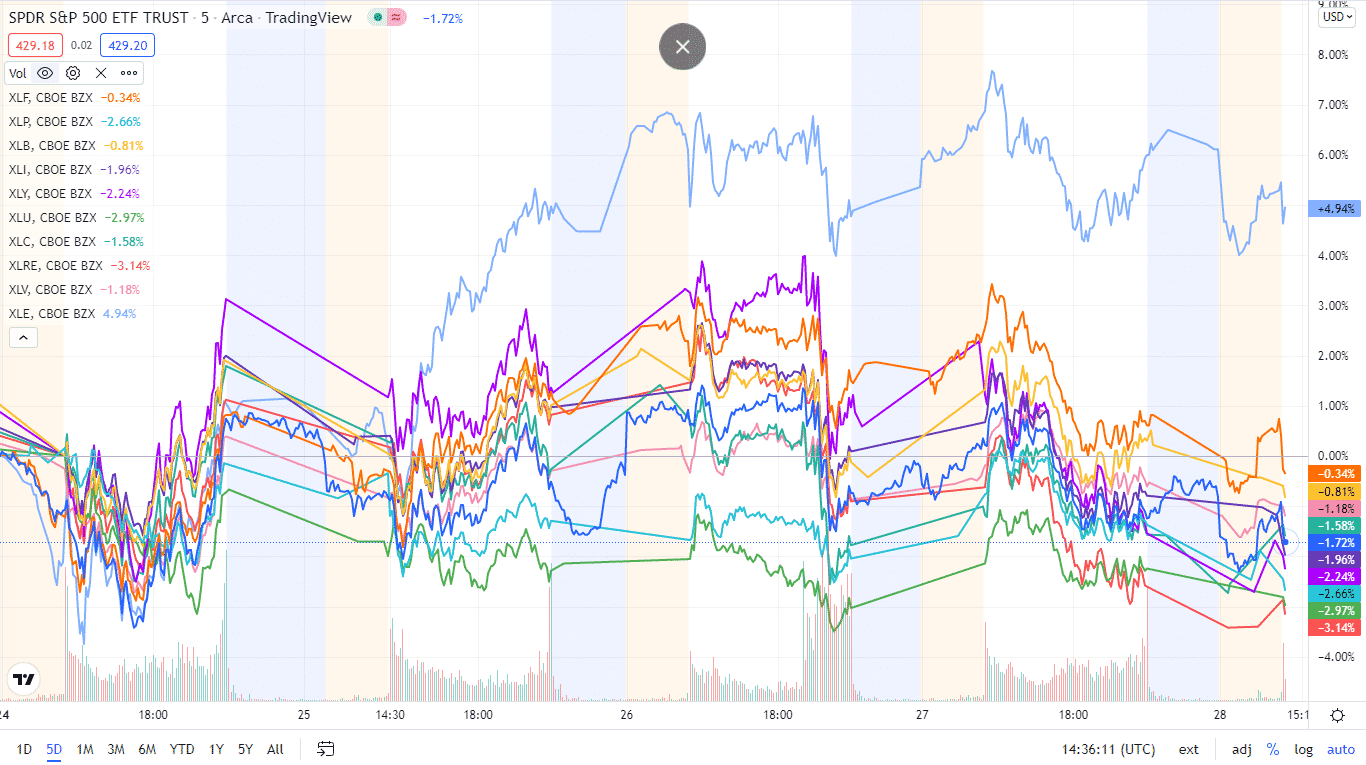
The S&P 500 individual sectors’ weekly chart
The following breakdown shows how the S&P 500 ended the week, using their corresponding ETFs. The year continues to be sour, with all the sectors losing out and finishing in the red, except for just two.
The S&P 500 individual sector, weekly performance breakdown |
|||
| 1. | Energy | XLE | +5.65% with the accompanying energy select sector ETF |
| 2. | Financial Services | XLF | +0.05% with the accompanying financial select sector ETF |
| 3. | Healthcare | XLV | -1.33% with the accompanying healthcare select sector ETF |
| 4. | Materials | XLB | -1.49% with the accompanying materials select sector ETF |
| 5. | Consumer Staples | XLP | -1.58% with the accompanying consumer staples select sector ETF |
| 6. | Information Technology | XLK | -1.99% with the accompanying information technology select sector ETF |
| 7. | Industrial | XLI | -2.14% with the accompanying industrial select sector ETF |
| 8. | Communication Services | XLC | -2.31% with the accompanying communication services select sector ETF |
| 9. | Utilities | XLU | -2.52% with the accompanying utilities select sector ETF |
| 10. | Consumer Discretionary | XLY | -3.19% with the accompanying consumer discretionary select sector ETF |
| 11. | Real Estate | XLRE | -3.48% with the accompanying real estate select sector ETF |


Comments