
It is the end of June, and the expectation is for the S&P 500 to pick a market side and trend. The good news is that finally, it is trading above the minor resistance level tuned support of $420-$421.5. The bad news is that prices are still flirting with the monthly resistance level at the $424.45-$424.60 range.
After the 14th-18th June trading week finished, many SPY investors were cursing, a week low of $414.99, Monday market open of $416.77 was a breath of fresh air and a sign of hope.
This Index ETF, which acts as a benchmark for most investors’ US economy, broke its sideways market duck exhibiting a bullish rally for three days. So Monday open of $416.77 to Wednesday close of $422.62. Thursday trading saw a market gap-up open of 0.2% for the markets to open at $424.91.
Unfortunately, rather than this being a launchpad for the $424.45-$424.60 monthly resistance compromise, prices are still trying to flirt with this resistance level. But, overall, the SPY moved from the red and now boosts a weekly positive change of +2.4%.
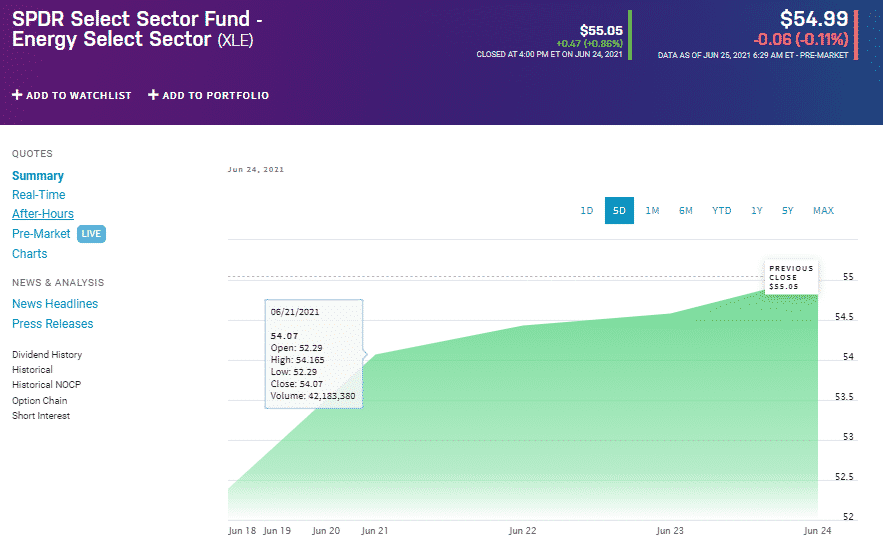
A look at the individual S&P 500 sectors reveals that the game of musical chairs is still afoot. The energy sector shook off the jitters of the Oil supply surplus from the middle-east to close the week with +8.52%. Biden led the administration in achieving a bipartisan agreement on construction spending to the tune of $973 billion, which is $579 billion above the current Fed levels.
Another sector at the forefront of driving the positive change of the SPY for the week was the Financial Services Sector, +7.83 weekly gain. This change is primarily attributable to the more than anticipated inflationary pressure, which might result in two interest rate hikes within 2023, 2-years earlier than the initial forecasted change in 2025. According to James Bullard, the St. Louis Fed president, the rise may come as early as 2022.
The only negative for the S&P 500 in a bullish week came through the utility sector. It is the only sector with a decline closing the week at -1.02% compared to the previous week. The utility sector is a haven for market downturn times, explaining investor shifts to the other sectors on the back of their newfound buoyancy.
Here is a chart of the eleven sectors’ year-to-date performance and how they have fared against the S&P 500.
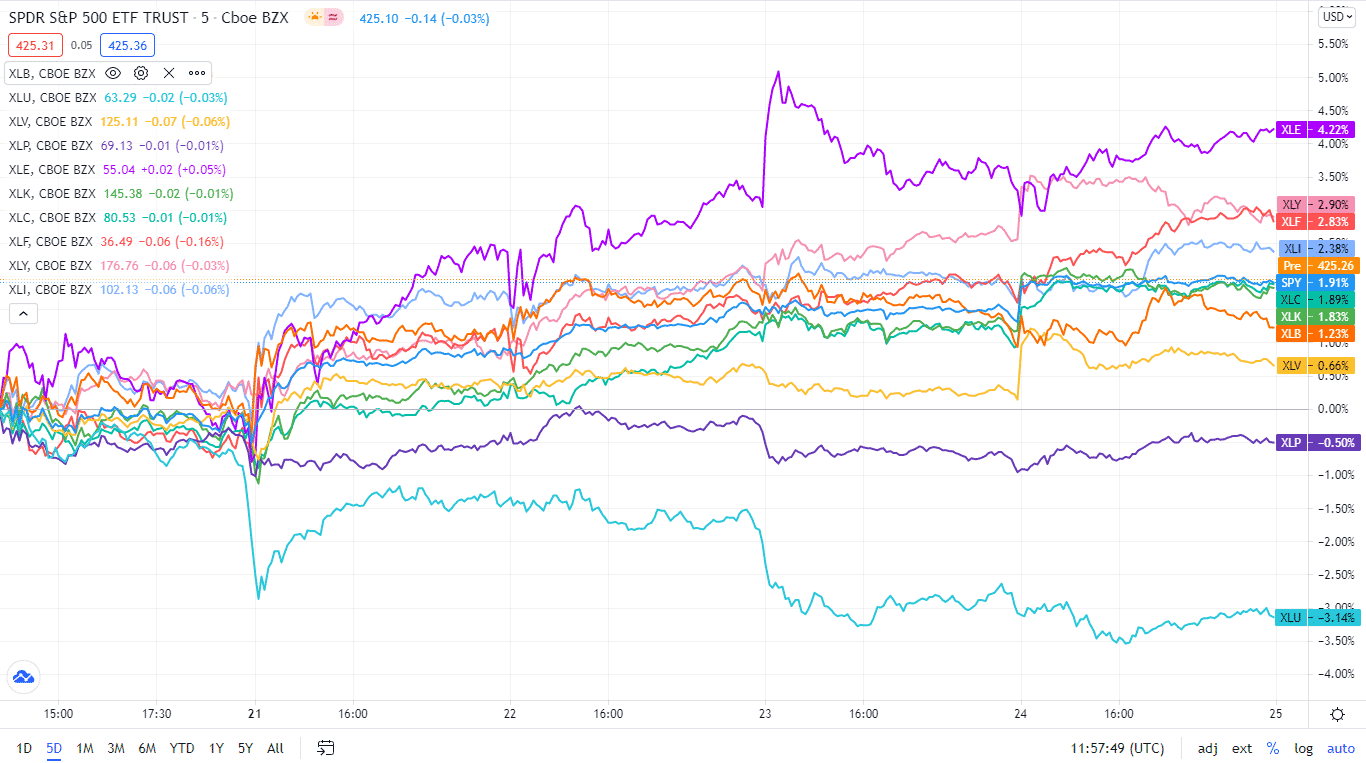
Below is a breakdown of the S&P 500 underlying sectors and their performance over the week-21st June to 25th June week, using their corresponding ETFs.
S&P 500 industry sector weekly performance breakdown |
|||
| 1. | Energy | XLE | +6.16% with the accompanying energy select sector ETF |
| 2. | Financial Services | XLF | +3.98% with the accompanying financial select sector ETF |
| 3. | Industrial | XLI | +2.82% with the accompanying industrial select sector ETF |
| 4. | Information Technology | XLK | +2.51% with the accompanying information technology select sector ETF |
| 5. | Consumer Discretionary | XLY | +2.31% with the accompanying consumer discretionary select sector ETF |
| 6. | Communication Services | XLC | +2.28% with the accompanying communication services select sector ETF |
| 7. | Materials | XLB | +2.07% with the accompanying materials select sector ETF |
| 8. | Healthcare | XLV | +1.55% with the accompanying healthcare select sector ETF |
| 9. | Consumer Staples | XLP | +1.04% with the accompanying consumer staples select sector ETF |
| 10. | Real Estate | XLRE | +0.65% with the accompanying real estate select sector ETF |
| 11. | Utilities | XLU | -0.47% with the accompanying utilities select sector ETF |


Comments