Another week and the S&P 500 chart is a mirror image of the previous charts for the last five weeks. Come Monday, market opening, a price of $422.73 seemed like the spark the SPY was waiting for to drop the rut and soar finally. Unfortunately for many traders, rather than start a bullish trend, it went straight down to the minor support at $421.20 before re-correcting.
The lowest price for the week was $420.61 on Tuesday and then market consolidation for the better part of Tuesday and Wednesday within the $422.27 — $423.05 range. This range was broken to the downside, a retreat in anticipation of the inflation data release.
The Consumer Price Index data exceeded the market expectations, but there was only a brief market spike; SPY hit a $424.50 price. However, the bullish rally was short-lived. There was a market retreat, yet again, with Friday trading happening around the $423.2 — $423.6 range. Despite being stuck in consolidation, the SPY is currently green, gaining 0.2% to push the year-to-date returns to +13.03% from +12.3%.
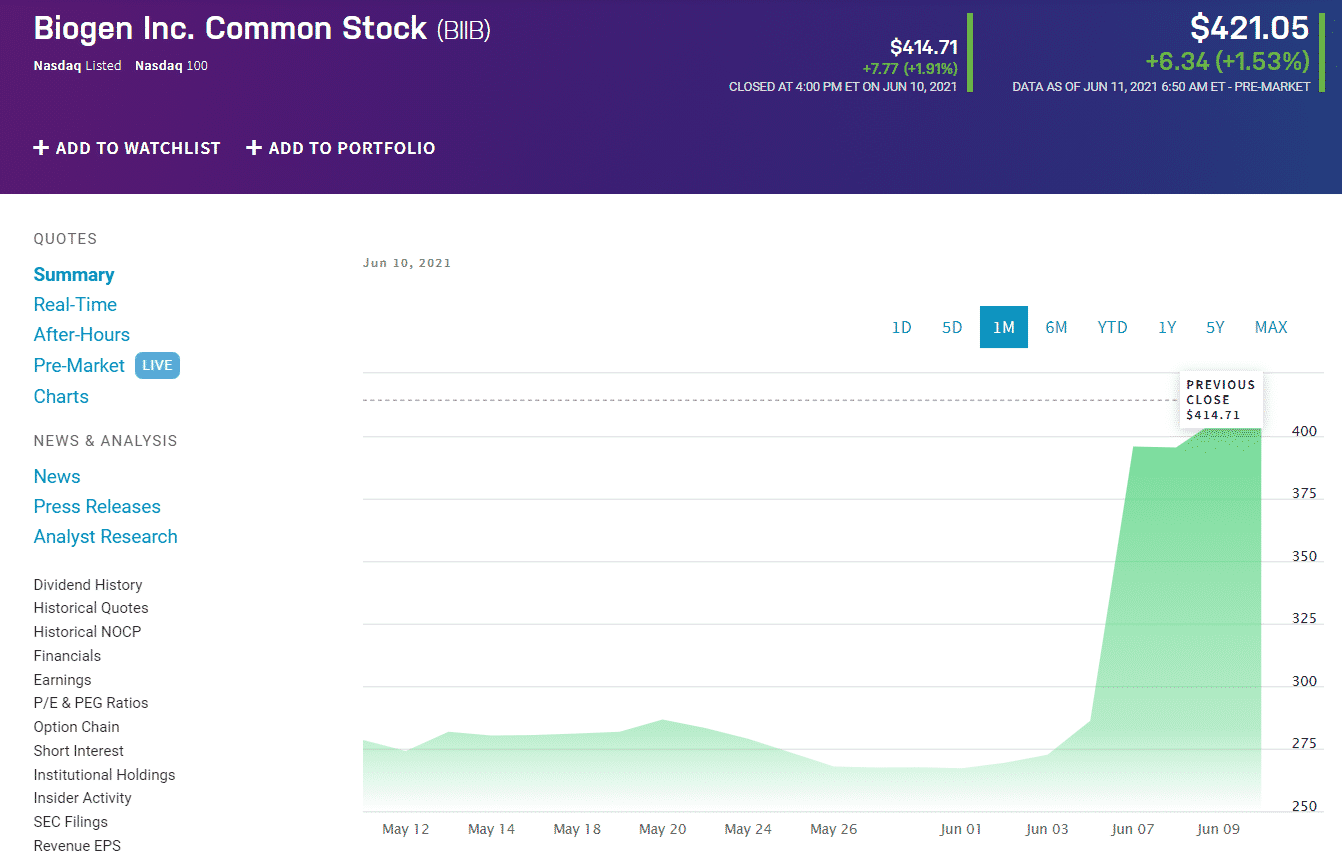
The game of musical chairs continues among the individual select sectors. In comparison to the previous week the most significant jump was by Healthcare, +4.14%. The news that the Johnson & Johnson Covid-19 vaccine remains effective against all the variants is a driving force for the Health Select sector surge. It is coupled with the FDA approval of Biogen’s drug Aduhelm-Alzheimer drug, marking a new frontier in the fight against the disease in two decades.
The healthcare sector was followed by Consumer Discretionary at +2.92%, with Information Technology rounding up the top 3 gainers at +1.54%.
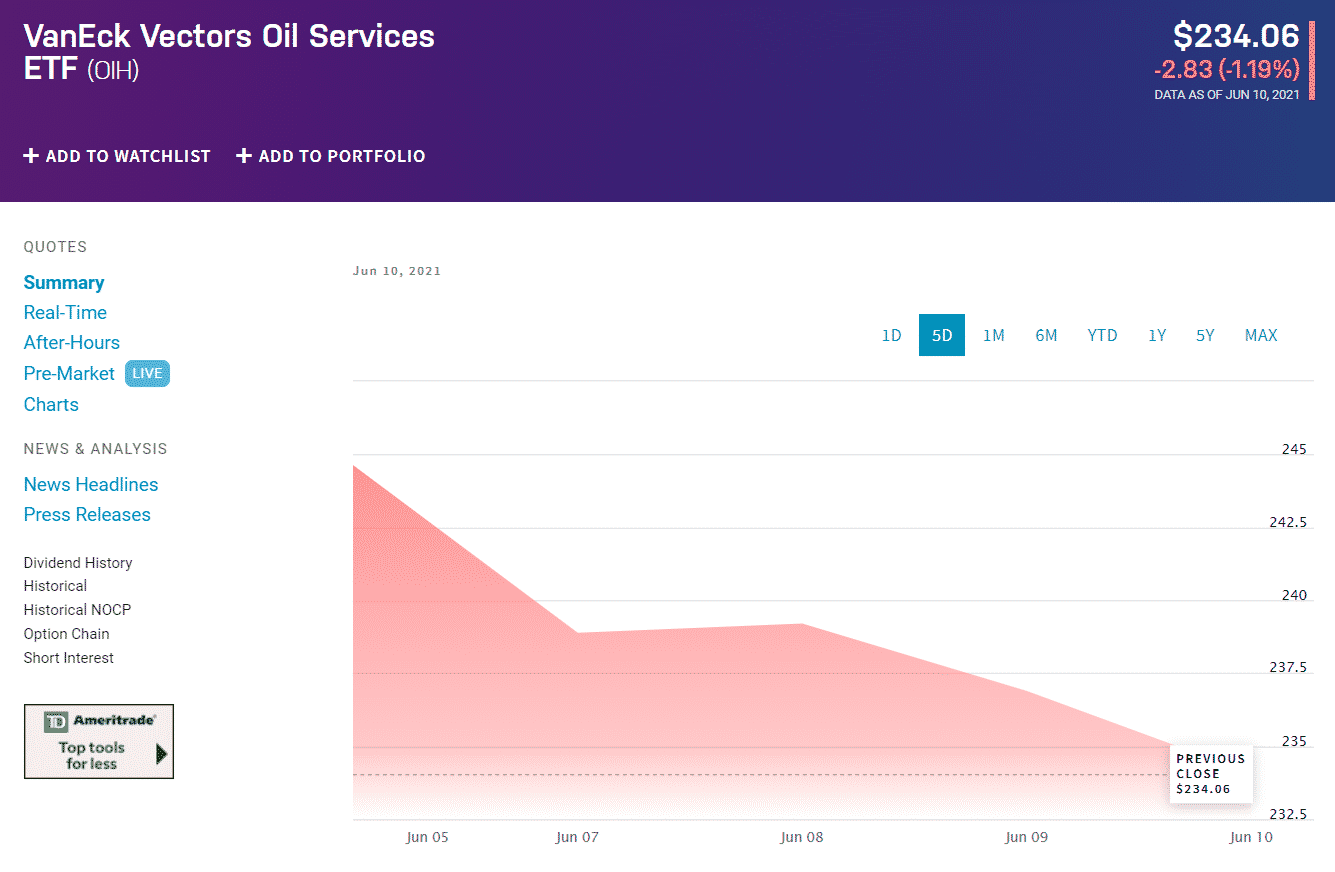
On the opposite side of the spectrum, the biggest loser was the Energy sector with a -6.25% drop, followed by Financial Services with a -3.99%, and finally Consumer Staples at -1.83%.
The drop in the energy sector is attributable to the news that Iran oil is back on the playing board, rendering the OPEC oil supply restrictions toothless.
The uncertainty in the market gets credit for the surge in the defensive sectors, Healthcare, Real Estate, and Consumer Discretionary. Here is a chart of the eleven sectors’ year-to-date performance and how they have fared against the S&P 500.
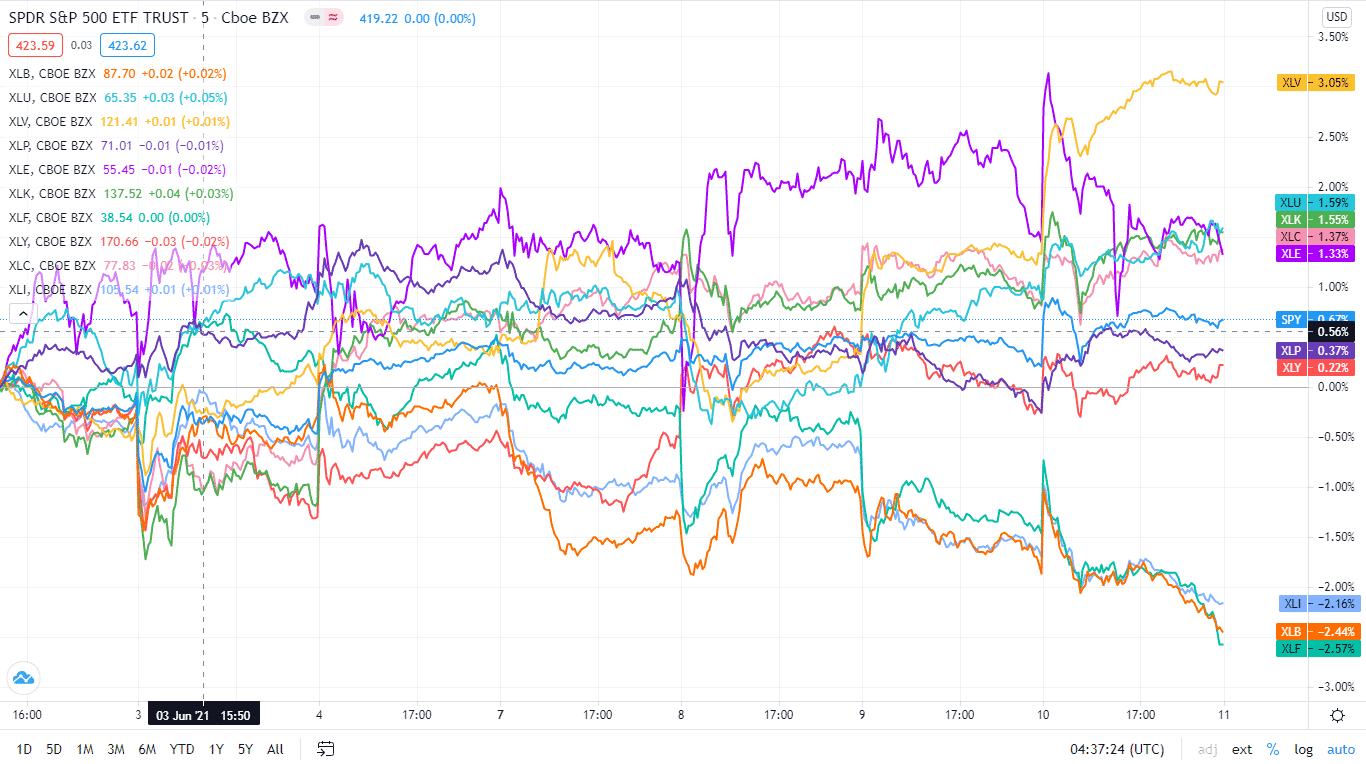
Below is a breakdown of the S&P 500 underlying sectors and their performance over the week-7th June to June 11th, using their corresponding ETFs.
| S&P 500 industry sector weekly performance breakdown | |||
| 1. | Healthcare | XLV | +2.67% with the accompanying health care select sector ETF |
| 2. | Real Estate | XLRE | +2.56% with the accompanying real estate select sector ETF |
| 3. | Consumer Discretionary | XLY | +1.13% with the accompanying consumer discretionary select sector ETF |
| 4. | Information Technology | XLK | +0.82% with the accompanying information technology select sector ETF |
| 5. | Communication Services | XLC | +0.82 with the accompanying utilities select sector ETF |
| 6. | Utilities | XLU | +0.81% with the accompanying consumer staples select sector ETF |
| 7. | Energy | XLE | -0.09% with the accompanying energy select sector ETF |
| 8. | Consumer Staples | XLP | -0.81% with the accompanying consumer staples select sector ETF |
| 9. | Industrial | XLI | -1.92% with the accompanying industrial select sector ETF |
| 10. | Materials | XLB | -2.38% with the accompanying materials select sector ETF |
| 11. | Financial Services | XLF | -2.97% with the accompanying financial services select sector ETF |


Comments