The start of the year has not been kind to the S&P 500. Rising inflation rates, supply chain bottlenecks, expected interest rate hikes, and the persistent coronavirus have started taking a toll on the markets.
Would SPY pick up its resilience for 2021 and go back to winning ways, or would it succumb to the current market uncertainty?
Monday market opening gap down of 0.1% to have the SPY start its trading at $464.14 was not a good sign given that it has been more than five weeks since the market experienced this phenomenon.
A quick backtest would reveal that SPY’s market movement for the week would be bearish after Monday’s market opening gap downs. With such data, it came as no surprise when the SPY slid further to the $457.41 pivotal level with no respite in between.
This pivot level coincided with the SPY just brushing its 50-day moving average, which is a significant psychological level for investors. Despite a constraining labor market, characterized by increased resignation and increasing wages, and inflation rates that are now higher than had been anticipated according to the CPI data, investors injected inflows off this pivot level to start a bullish run that was arrested on Thursday by the monthly pivotal level at $469.75. In addition to all this, experts are now saying the Covid-19 virus eradication is only by continuous vaccination will ensure enough communal protection to go back to normalcy.
Top gainers of the current week
Energy Sector
With investors moving from growth stocks to value stocks because of building market uncertainty, energy took the chunk of this inflows to finish the second week running at the top of the table +2.70%.
Financial Services Sector
Banks and financial institutions have been the biggest beneficiaries of the pandemic stimulus. The result has been phenomenal deposits that can be utilized to advance credit and other interest-earning products. Add to this, the expected interest rate hikes and inflows continue trickling into the financial services sector to end the week at +1.24%.
Materials Sector
The focus now in an attempt to curb inflation is ensuring raw material security in 2022, resulting in a positive week for the materials sector, +0.25%.
Losers of the current week
Sectors that dragged the SPY to its worst trading week in a while were;
Real Estate sector at — 0.81%
Information Technology sector at — 0.94%
Consumer discretionary sector at — 1.03%
The uncertain economic conditions have investors channeling money into value sectors while shunning growth sectors resulting in the sectors above taking the full force of this investment strategy.
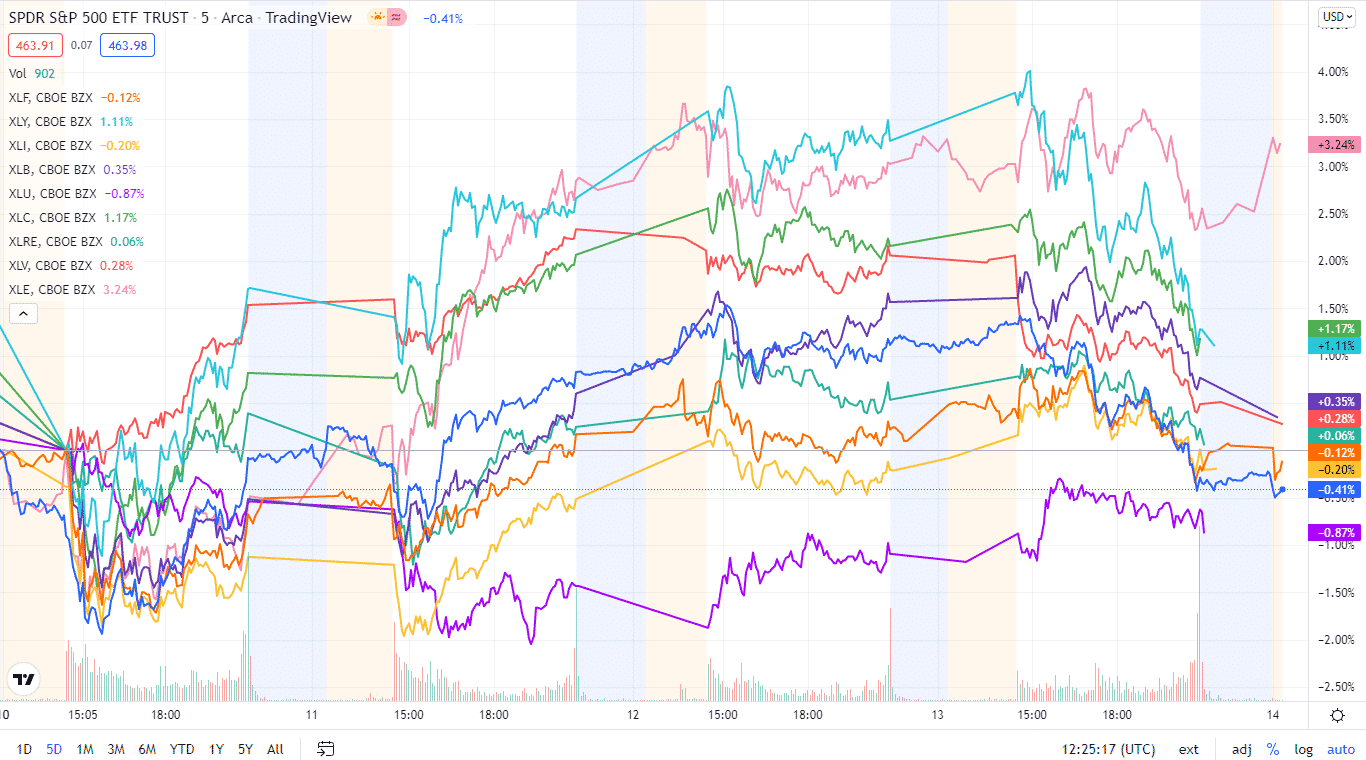
Below is a performance chart of the S&P 500 over the week and its component sectors.

The S&P 500 individual sectors’ weekly chart
The following breakdown shows how the S&P 500 ended the week, using their corresponding ETFs. The year continues to be sour, with most sectors being in the red for the week.
The S&P 500 individual sector, weekly performance breakdown |
|||
| 1. | Energy | XLE | +2.7% with the accompanying energy select sector ETF |
| 2. | Financial Services | XLF | +1.24% with the accompanying financial select sector ETF |
| 3. | Materials | XLB | +0.25% with the accompanying materials select sector ETF |
| 4. | Consumer Staples | XLP | +0.19% with the accompanying consumer staples select sector ETF |
| 5. | Communication Services | XLC | -0.01% with the accompanying communication services select sector ETF |
| 6. | Industrial | XLI | -0.04% with the accompanying industrial select sector ETF |
| 7. | Healthcare | XLV | -0.12% with the accompanying healthcare select sector ETF |
| 8. | Utilities | XLU | -0.75% with the accompanying utilities select sector ETF |
| 9. | Real Estate | XLRE | -0.81% with the accompanying real estate select sector ETF |
| 10. | Information Technology | XLK | -0.94% with the accompanying information technology select sector ETF |
| 11. | Consumer Discretionary | XLY | -1.03% with the accompanying consumer discretionary select sector ETF |


Comments