The materials sector is the largest segment of the global economy and is a multi-trillion-dollar industry. Tucked in one corner of this massive giant is the primary materials segment, whose growth is spurred by the rising global consumer demand and is expected to grow at a CAGR of 13.5% by 2025.
This provides an opportunity to invest in this corner of the materials industry. Still, there is a caveat: these stocks are highly susceptible to global economic fluctuations, inflationary pressures, and greenback fluctuations. Therefore, as the global economy continues its recovery post-pandemic, these three basic materials ETFs offer diversified exposure to this corner of the materials sector and mitigation against the inherent volatility of this niche.
What is the composition of basic materials ETF?
Before getting into the composition of basic materials ETF, we first define basic materials. Basic materials refer to raw materials used in production and materials utilized in the construction segment. In most cases, they are natural resources, but some processed materials also form part of this segment; metals, timber, glass, oil, lumber, and chemicals. As such, basic materials ETF comprise equities involved in the exploration, mining, processing, and production of raw materials.
The best three basic materials ETF to bet on this year
Investors interested in trading the commodities sector have experienced quite the volatility to date. The ongoing Ukraine-Russia war, the spread of omicron variant and closure of China, supply chain bottlenecks, and the rising inflation resulting in increased materials prices have all heightened the volatility of an already volatile sector inherently.
Despite all these, the economy is expanding, meaning some basic materials ETFs are in a bullish cycle and worth a look at, especially the three below.
№ 1. Vanguard Materials ETF (VAW)
Price: $187.27
Expense ratio: 0.10%
Annual dividend yield: 1.45%
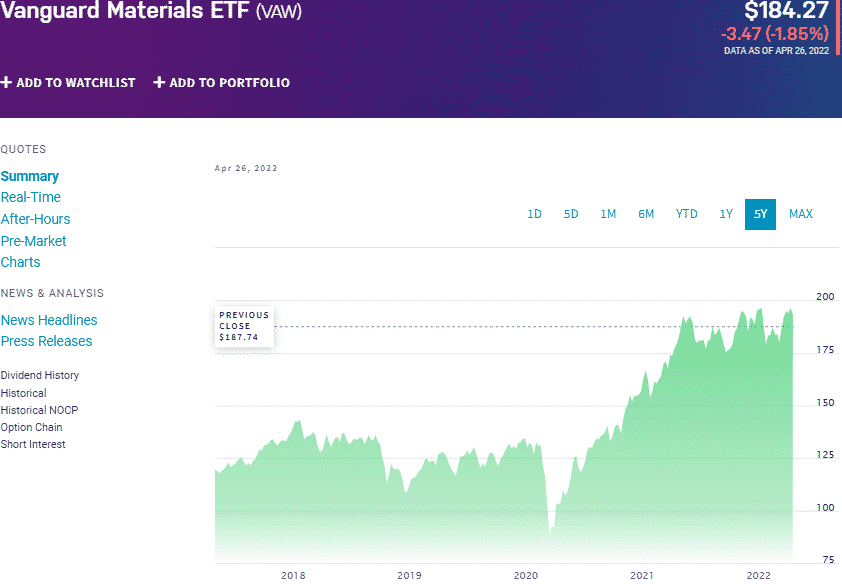
VAW chart
The Vanguard Materials ETF tracks the performance of the MSCI US Investable Market Index (IMI)/Materials 25/50, utilizing an indexing investment strategy that tries to assign the same weight to holdings as the tracked index. The fund exposes customers to upwards of US publicly traded large-cap, mid-cap, and small-cap equities, operating within the material segment.
In a list of 40 natural resource funds, the VAW ETF is ranked № 2 for long-term investing.
The top three holdings of this basic materials ETF are:
- Linde plc – 12.42%
- Freeport-McMoRan, Inc. – 5.54%
- Newmont Corporation – 4.81%
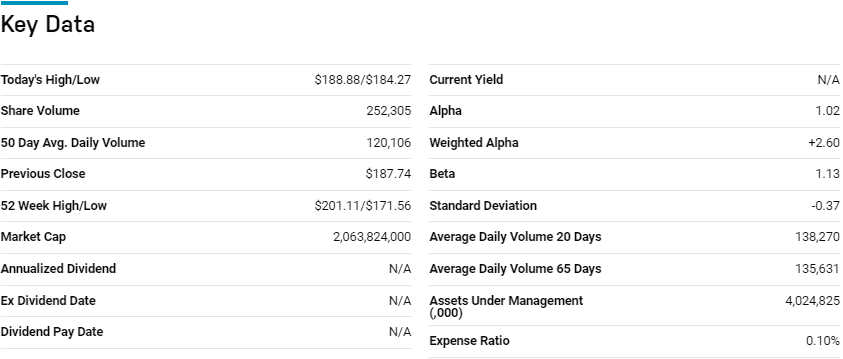
The VAW ETF boasts $4.03 billion in assets under management, with investors parting with a measly $10 annually for a $10000 investment. Having upwards of 100 equities and a pretty even weighting reduces the inherent volatility of the materials sector and results in a resilient fund.
Additionally, this ETF is an indirect play on commodity prices, acting as a hedge against inflation. Couple this with commission-free trading of Vanguard accounts and a relatively low expense ratio, and this ETF can offer not only returns but significant regular income necessary to navigate the current inflation rising environment; 5-year returns of 71.50%, 3-year returns of 56.43%,1-year returns of 5.27, and an annual dividend yield of 1.45%.
№ 2. Materials Select Sector SPDR Fund (XLB)
Price: $84.18
Expense ratio: 0.10%
Annual dividend yield: 1.55%
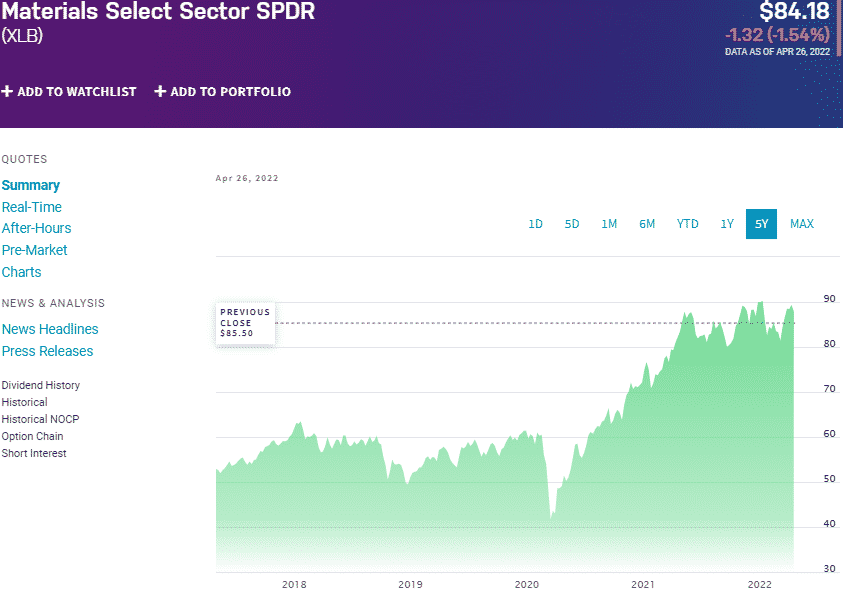
XLB chart
You cannot make a list of materials ETFs and leave out the Materials Select Sector SPDR Fund. It is the most liquid and popular fund operating in the materials segment. This ETF tracks the price and yield performance of the Materials Select Sector Index, net of expenses, and fees. It invests at least 95% of its total assets in the tracked index underlying holdings.
The XLB exposes investors to US publicly traded equities plying their trade in the metals and mining industry, chemicals, paper, forest products, construction materials, and containers and packaging segments.
In a list of 40 natural resource funds, the XLB ETF is ranked № 4 for long-term investing.
The top three holdings of materials ETF are:
- Linde plc – 16.29%
- Freeport-McMoRan, Inc. – 6.31%
- Newmont Corporation – 6.10%
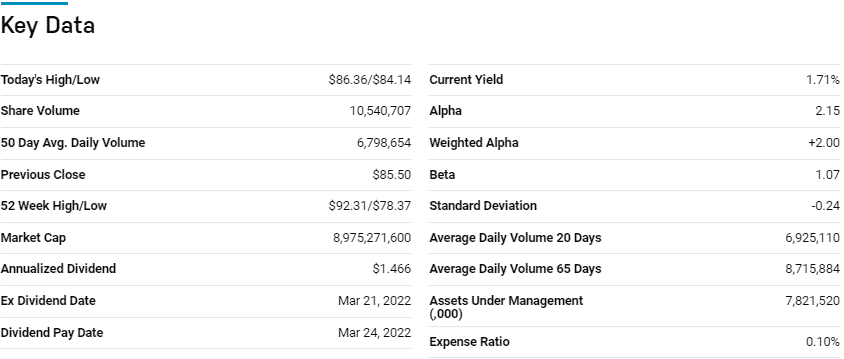
The XLB ETF has $7.82 billion in assets under management, with an expense ratio of 0.10%. A higher daily trading volume, excellent liquidity, and relatively low expense ratio make the XLB an investor favorite.
In addition, its exposure to the whole spectrum of the materials segment provides for diversification and the ability to weather market downturn; 5-year returns of 78.76%, 3-year returns of 58.35%, and 1-year returns of 4.94%, and a decent annual dividend yield of 1.55%.
№ 3. Fidelity MSCI Materials ETF (FMAT)
Price: $47.15
Expense ratio: 0.08%
Annual dividend yield: 1.42%
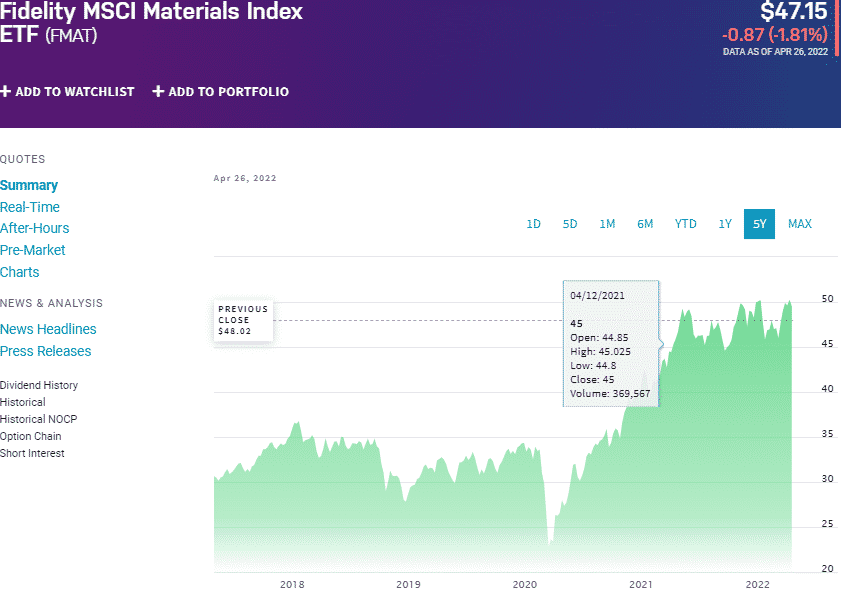
FMAT chart
The Fidelity MSCI Materials ETF tracks the MSCI USA IMI Materials 25/50 Index investment performance, net of expenses, and fees. It invests at least 80% of its total assets in the tracked index underlying holdings. It exposes investors to US-listed equities operating within the materials segment.
In a list of 40 natural resource funds, the XLB ETF is ranked № 1 for long-term investing.
The top three holdings of this global internet fund are:
- Linde plc – 12.38%
- Freeport-McMoRan, Inc. – 4.88%
- Sherwin-Williams Company – 4.76%
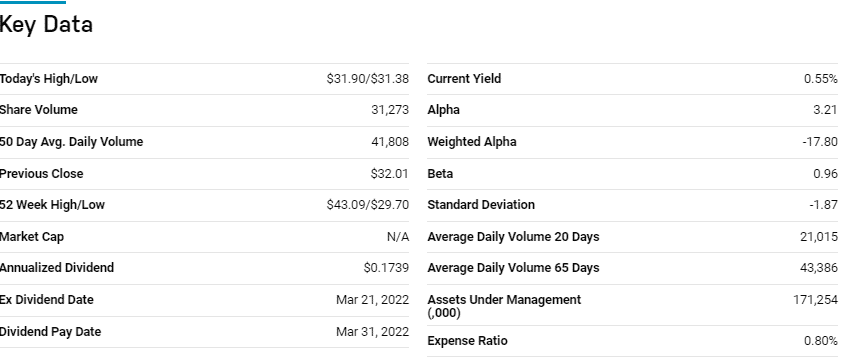
The FMAT ETF is the smallest fund on this list with $559.7 million in assets under management but beats the others for a bargain with the lowest expense ratio on this list, 0.08%. A collection of more than 100 materials equities results in a diversified fund with the resilience to withstand market downturn while a pretty even weighting mitigates against concentration risk.
A historical view shows that this fund tends to outperform both its category and segment averages, making it worth considering investing in materials; 5-year returns of 71.42%, 3-year returns of 56.57%, and 1-year return of 5.21%, and an annual dividend yield of 1.42%.
Final thoughts
With Biden’s infrastructure dream firmly on track, a global economic resumption from Covid-19, and expanding consumer expenditure, the materials segment is just starting a significant bullish run. The three ETFs herein are in pole position to benefit.


Comments