
China might be the global consumer powerhouse, but it shares its border with India, the fastest growing economy globally. In addition to this, it is an economy that features a young, highly educated, relatively cheap labor market that can sustain this accelerated growth. The Indian government has also made foreign direct investment a cornerstone of its economic development, providing the legal structure and tax incentives that keep foreign investors coming back to India as an investment option.
How do you invest in this emerging mega economy? Geopolitical risks due to sharing a contentious border with China calls for prudent investing to mitigate against geopolitical volatility. Investors have Indian ETFs to ensure risk-controlled investment in this fast-paced economy.
What is the composition of Indian ETFs?
Indian ETFs are exchange-traded funds made up of companies either domiciled in India or equities with significant resources invested in the Indian economy, at least 50%, or equities deriving substantial revenues from the Indian economy, ideally 50%. Indian ETFs on this list include all exchange-traded funds with significant exposure to the Indian economy.
Top 7 Indian ETFs
The youngest population globally, favorable foreign direct investment policies, and a high volume and increased spending consumer market provide for a fast-paced demand-driven economy excellent for economic growth. These seven Indian ETFs expose investors to this emerging mega-economy pipped to quadruple by 2025.
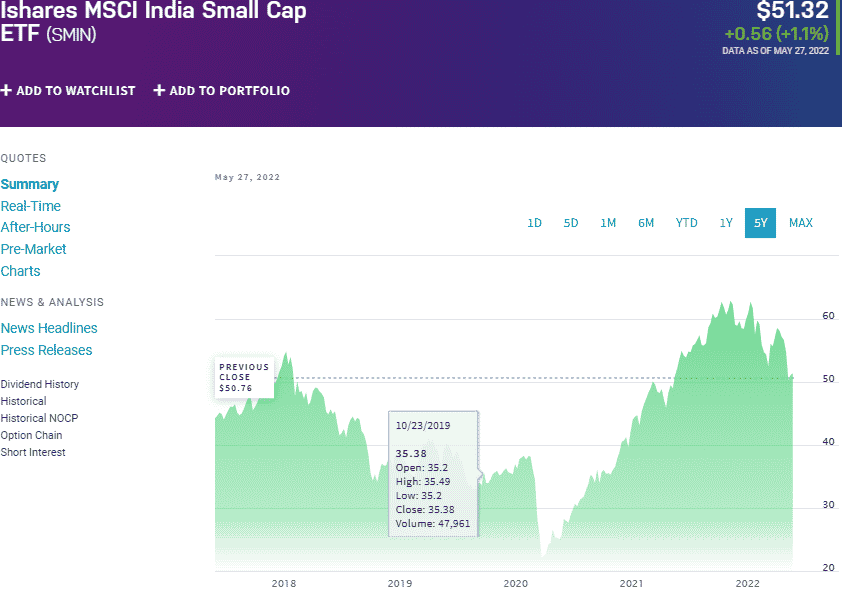
iShares MSCI India Small-Cap ETF (SMIN)
Price: $51.32
Expense ratio: 0.74%
Dividend yield: 0.08%
SMIN chart
One of the most popular and liquid funds providing pureplay exposure to the Indian economy is the iShares MSCI India Small-Cap ETF, which tracks the performance of the MSCI India Small Cap Index. It invests at least 80% of its assets in the holdings of its composite index and investment assets that exhibit identical economic characteristics to these under holdings. It exposes investors to the Indian Small-Cap equity segment.
SMIN ETF is ranked №1 by US News analysts among 13 of the best Indian equity funds for long-term investing.
The top three holdings of this fund are:
- Tata Elxsi Limited – 1.74%
- Adani Power Limited – 1.44%
- BlackRock Cash Funds Treasury SL Agency Shares – 1.35%
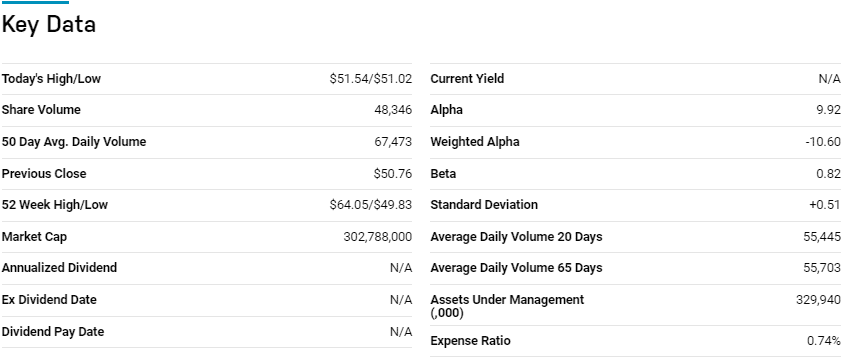
The SMIN ETF has $297.2 million in assets under management, at an expense ratio of 0.74%. An equal weighting across 240 small-cap equities and the fast-paced economic growth of the Indian economy provides tremendous long-term and upside potential, not; 5-year returns of 27.05%, 3-year returns of 34.49%, and 1-year returns of -1.80%.
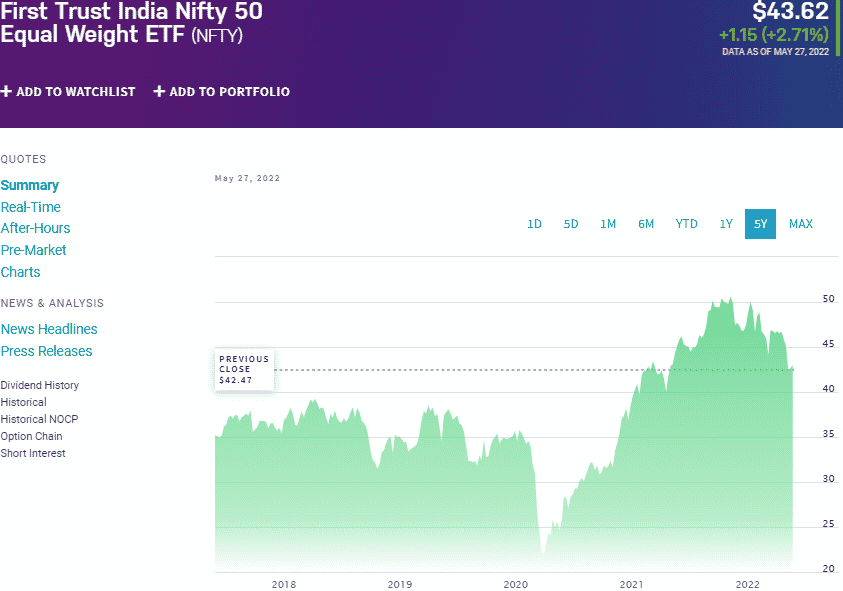
First Trust India Nifty 50 Equal Weight Fund (NFTY)
Price: $43.62
Expense ratio: 0.80%
Dividend yield: 0.49%
NFTY chart
The First Trust India Nifty 50 Equal Weight Fund tracks the price and yield performance of the NIFTY 50 Equal Weight Index, net of fees, and expenses. It invests at least 90% of its net assets in common stocks to meet its investment objective, making up the composite index. It exposes investors to fifty of the largest and most liquid Indian investment securities listed with the National Indian Stock Exchange and, as a result, 60% of the Indian equity market.
The top three holdings of this fund are:
- Mahindra & Mahindra Ltd. – 2.56%
- Hindustan Unilever Limited – 2.45%
- Britannia Industries Ltd – 2.44%
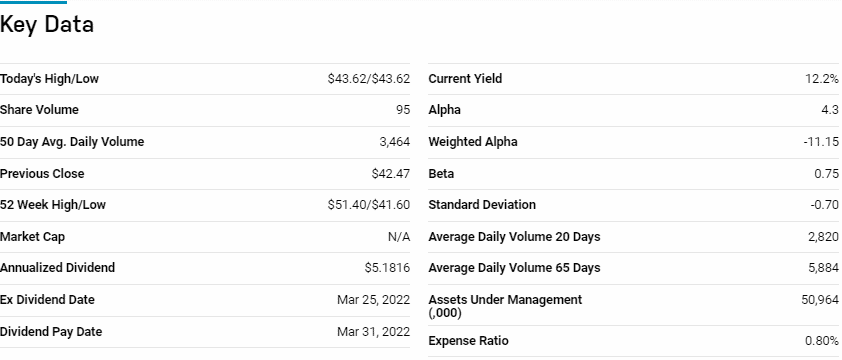
The NFTY ETF has $51.0 million in assets under management, with an expense ratio of 0.80%. Equal weighting and considering liquidity and capital outlay in equity screening results in a fund full of Indian blue-chip companies providing resilience in a market downturn; 5-year returns of 34.24%, 3-year returns of 18.66%, 1-year returns of -2.22%
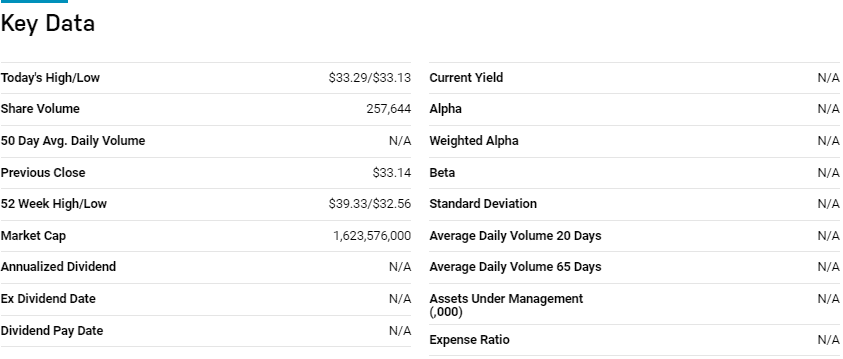
WisdomTree India Earnings Fund (EPI)
Price: $33.27
Expense ratio: 0.57%
Dividend yield: 0.83%
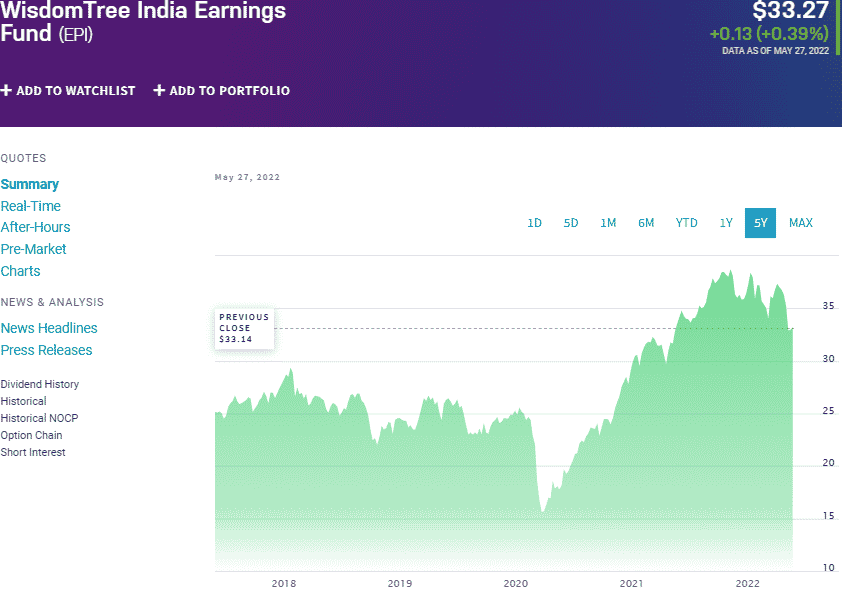
EPI chart
The WisdomTree India Earnings Fund tracks the performance of the WisdomTree India Earnings Index, net of fees, and expenses. It invests at least 95% of its total assets in the holdings to ensure minimal return deviation, making up the composite index and other investment assets with similar economic characteristics. It exposes investors to the most profitable equities domiciled in India.
The top three holdings of this fund are:
- Reliance Industries Limited – 9.00%
- Infosys Limited – 4.79%
- Housing Development Finance Corporation Limited – 4.74%
The EPI has $746.7 million in assets under management, with investors having to part with $84 annually for a $10000 investment. A unique weighting based on earnings rather than weight capping results in exposure to Indian heavyweight equities and a chance at more than average returns load; 5-year returns of 41.28%, 3-year returns of 31.55%, and 1-year returns of 0.07%.
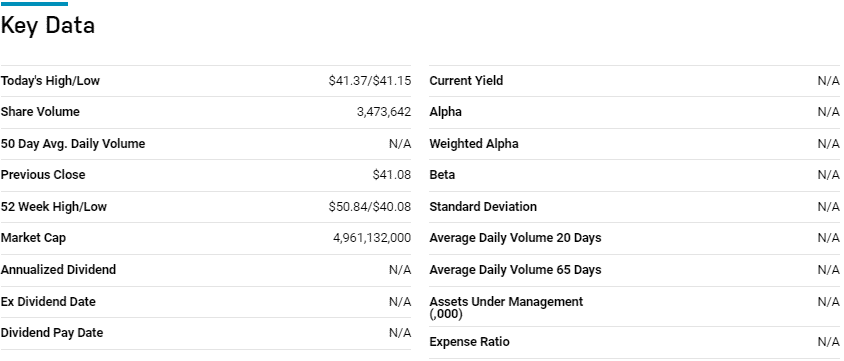
iShares MSCI India ETF (INDA)
Price: $41.36
Expense ratio: 0.69%
Annual dividend yield: 0.15%
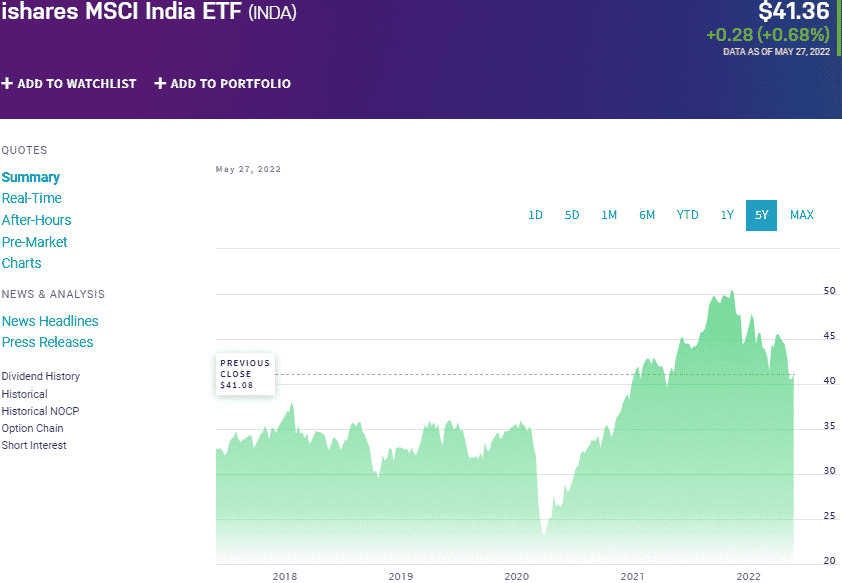
INDA chart
The most liquid and popular Indian exchange-traded fund is the iShares MSCI India ETF which tracks the MSCI India Index, net fees, and expenses. It invests at least 80% of its total assets in the holdings making up the composite index and other investment assets with similar economic characteristics. Investors in the INDA ETF gain exposure to this mega emerging markets economy’s large and mid-cap equity segments.
Among 13 Indian funds, USNews has the INDA ETF at No 3 for long-term investing.
The top three holdings of this ETF are:
- Reliance Industries Limited – 10.77%
- Infosys Limited – 7.02%
- Housing Development Finance Corporation Limited – 5.75%
The INDA ETF boasts $4.9 billion in assets under management, with an expense ratio of 0.69%. Combining large and mid-cap equities exposes investors to the tremendous growth of this emerging market while mitigating against the inherent volatility of emerging economies. Its relative cheapness results in high liquidity, making this fund a mainstay investment option if considering Indian investment. It also results in consistent returns; 5-year returns of 40.95%, 3-year returns of 25.95%, and 1-year returns of -0.48%.
Invesco India ETF (PIN)
Price: $23.86
Expense ratio: 0.97%
Annual dividend yield: 0.91%
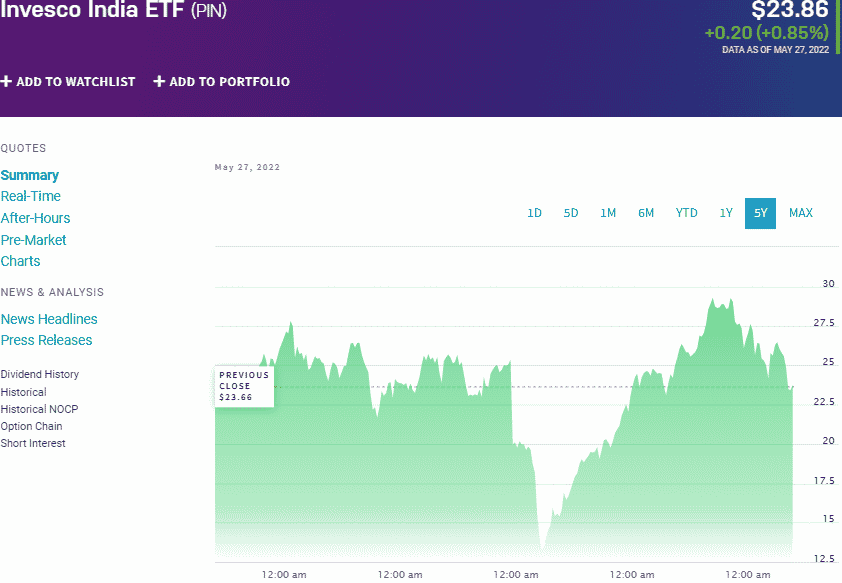
PIN chart
Invesco India ETF tracks the performance of the FTSE India Quality and Yield Select Index, net of fees, and expenses. It invests at least 90% of its assets in the holdings of its composite index and all associated ADRs and GDRs. It exposes investors to the Indian equity market.
The top three holdings of this ETF are:
- FTSE India Quality and Yield Select Index – 10.84%
- Infosys Limited – 7.96%
- Housing Development Finance Corporation Limited – 6.22%
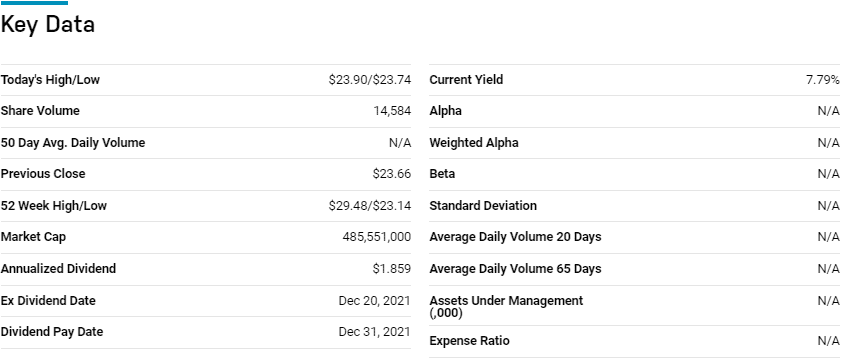
The PIN ETF has $91.7 million in assets under management, with an expense ratio of 0.78%. A holding base of 50 holdings seems ideal, but being overweight on the top ten holdings calls for prudent investing due to concentration risk. Nevertheless, large-cap equities form the majority of the concentration providing the financial clout to weather market downturn; 5-year returns of 45.62%, 3-year returns of 30.08%, and 1-year returns of -0.34%.
Columbia India Consumer ETF (INCO)
Price: $49.62
Expense ratio: 0.75%
Dividend yield: 0.28%
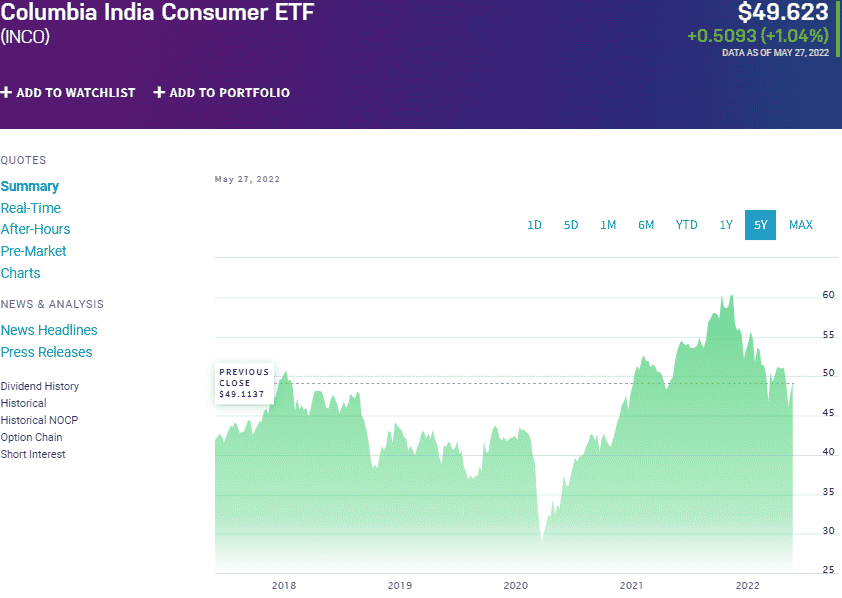
INCO chart
The Columbia India Consumer ETF tracks the performance of the Indxx India Consumer Index, net of expenses and fees. Investing at least 90% of its total assets in the equities, making up its composite index, exposes investors to Indian companies operating in the consumer segment.
The top three holdings of this fund are:
- MUTUAL FUND (OTHER) – 30.22%
- Mahindra & Mahindra Ltd. – 6.17%
- ITC Limited – 5.42%
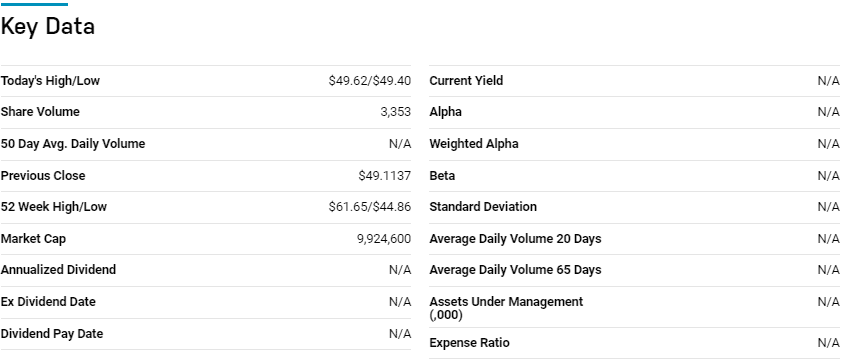
The INCO ETF has $75.8 million in assets under management, with an expense ratio of 0.75%. With the Indian population made up mainly of a younger and more educated population, the consumer segment is one of the fastest-growing economic sections with tremendous long-term potential.
Stradling, both consumer discretionary and consumer staples segments, provides value and growth attributes to this fund and ensures consistent returns; 5-year returns of 30.77%, 3-year returns of 28.72%, and 1-year returns of -1.23%.
First Trust BICK Index Fund (BICK)
Price: $28.00
Expense ratio: 0.64%
Dividend yield: 0.66%
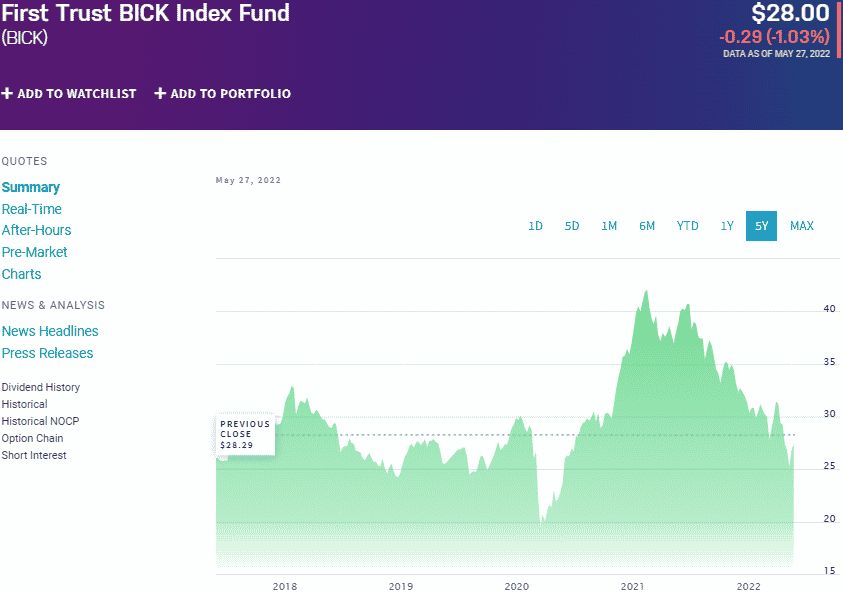
BICK chart
The First Trust BICK Index Fund tracks the yield and price performance of the ISE BICKTM, net of expenses, and fees. It invests at least 90% in its underlying index and all associated depository receipts. It exposes investors to the emerging markets in the BRIC category but with a twist by swapping Russia with South Korea.
The top three holdings of this fund are:
- Dr. Reddy’s Laboratories Ltd. Sponsored ADR – 2.35%
- Reliance Industries Limited Sponsored GDR 144A – 2.35%
- MakeMyTrip Ltd. – 2.32%
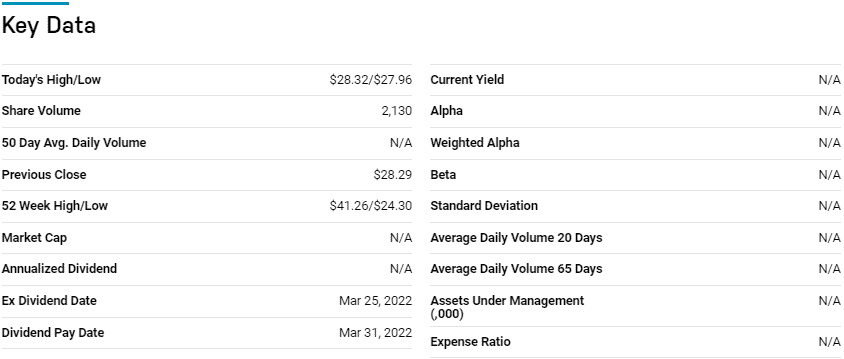
The BICK ETF has $16.8 million in assets under management, with an expense ratio of 0.64%. This is a diversified play on the Indian economy by including others avoiding oil and gas skewness and replacing Russia with South Korea. Couple this with a pretty even weighting. The result is a fund with an excellent upside potential that features geographical diversification and mitigation against equity-specific concentration; 5-year returns of 15.82%, 3-year returns of 15.05%, and 1-year returns of -25.89%.
Final thoughts
In the post-pandemic world, India has recorded the fastest economic growth globally. In addition to being a mega emerging market economy, it is the second-most populous nation globally, providing one of the largest consumer markets. The seven ETFs above give investors exposure to this economy and a chance at tremendous upside potential.


Comments