
The midway point of June and the S&P 500 is still flirting with direct support, at the $412-$414 range. The minor support at $420-$421.5.
After finishing the 7th-11th June trading week on a high, close at $424.28, the SPY Monday market open continued the bullish trend last week, with the price at $424.45.
Unfortunately, jitters on the FED’s chairman address could not fuel the market any further, resulting in consolidation. This sideways market ended near the market close by a short bullish rally that had the SPY reach a $425.43 high.
Tuesday, July 15th, marked the start of the SPY sideways market, as has been the norm in previous weeks. However, the market re-corrected, and Powell’s address was the fuel to drive the S&P 500 lower than the minor support at $420, attaining a weekly low of $419.33 on Thursday.
Come Friday, and the SPY again rallied upwards to operate within the $420.5-$422 range. So the chart shows a mirror image of the previous with the markets testing the support but lacking the momentum to compromise its integrity.
Unfortunately for investors in the SPY, the weekly market direction was bearish, given a weekly drop of -0.54%, luckily maintaining the year-to-date return at +13%.
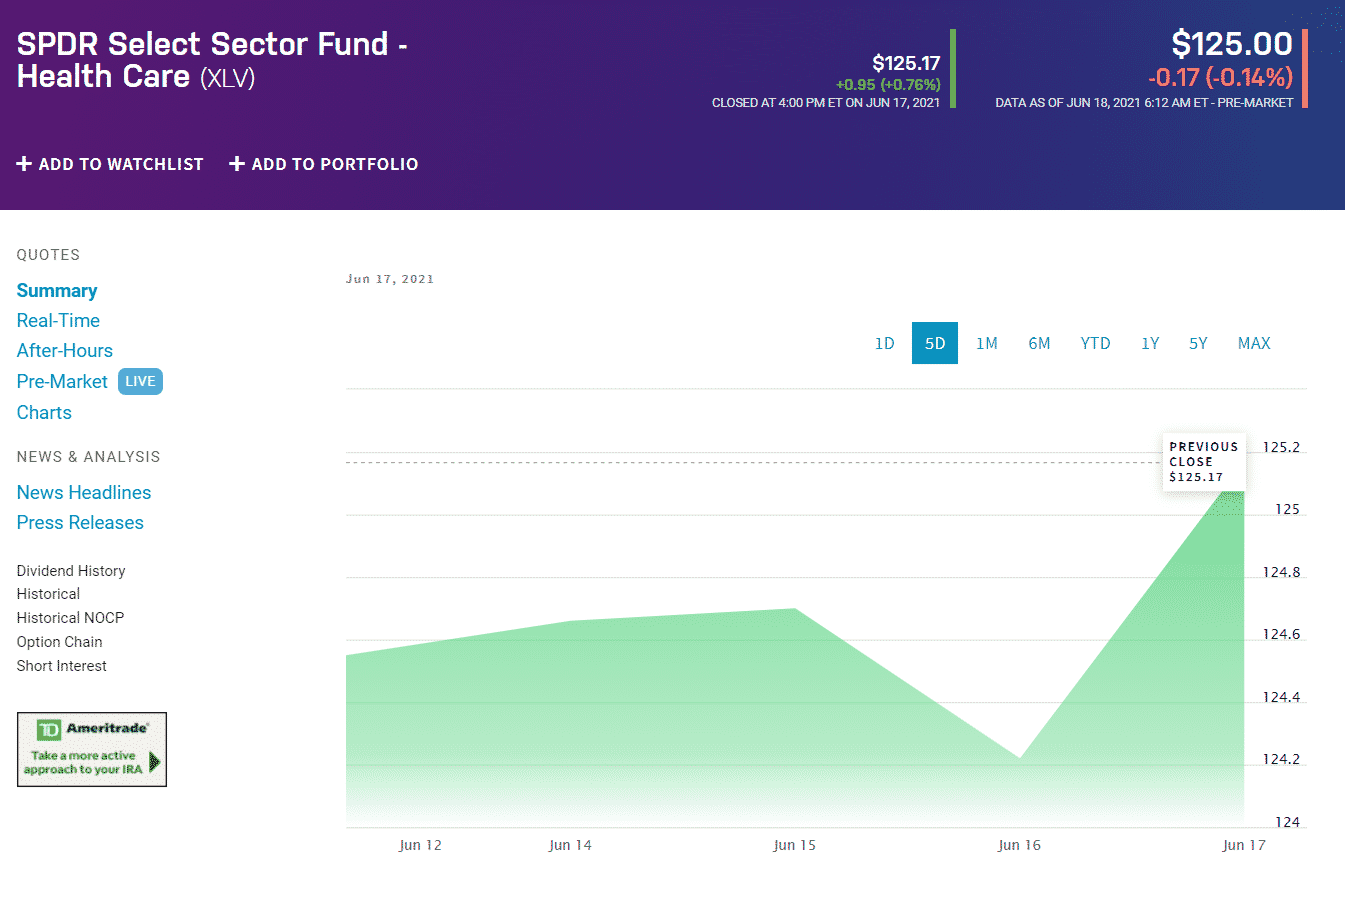
An analysis of the individual S&P 500 sectors shows a continuation of musical chairs, albeit with all the sectors recording negative change compared to the previous week. After riding on the back of Biogen and Johnson & Johnson’s backs to record the positive difference in the last week, the Healthcare select sector lost steam resulting in a -2.1% change.
The Real Estate select sector broke quite a few assets by changing its status as a haven asset to record a -1.96%. Rounding off the top three list of the biggest losers is the Material sector at -1.8%.
Change in the Real Estate sector is attributable to realizing that economic normalcy is still a dream until later in 2022, tentatively. What this means is that the Commercial Real Estate sector is still underperforming. The Financial sector also expects a rise in interest rates shortly. Hence, most financial institutions hoard cash reserves in anticipation, which explains the industry being red as at present.
Here is a chart of the eleven sectors’ year-to-date performance and how they have fared against the S&P 500.
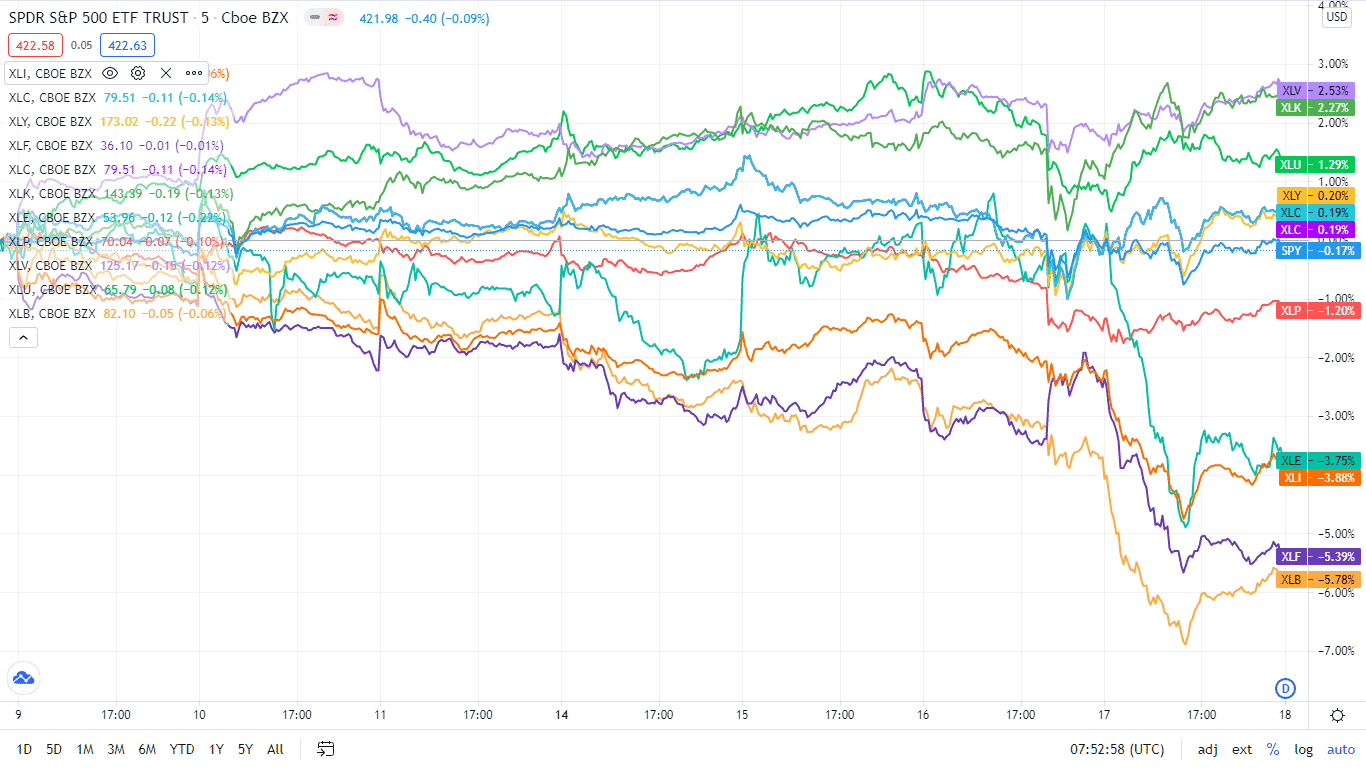
Below is a breakdown of the S&P 500 underlying sectors and their performance over the week-14th June to June 18th, using their corresponding ETFs.
S&P 500 industry sector weekly performance breakdown |
|||
| 1. | Information Technology | XLK | +1.04% with the accompanying information technology select sector ETF |
| 2. | Healthcare | XLV | +0.46% with the accompanying healthcare select sector ETF |
| 3. | Consumer Discretionary | XLY | +0.4% with the accompanying consumer discretionary select sector ETF |
| 4. | Communication Services | XLC | +0.06 with the accompanying communication services select sector ETF |
| 5. | Utilities | XLU | 0.55% with the accompanying utilities select sector ETF |
| 6. | Real Estate | XLRE | -1.15% with the accompanying real estate select sector ETF |
| 7. | Consumer Staples | XLP | -1.28% with the accompanying consumer staples select sector ETF |
| 8. | Energy | XLE | -2.36% with the accompanying energy select sector ETF |
| 9. | Industrial | XLI | -2.54% with the accompanying industrial select sector ETF |
| 10. | Financial Services | XLF | -3.85% with the accompanying financial select sector ETF |
| 11. | Materials | XLB | -4.77 with the accompanying materials select sector ETF |


Comments