
Why aren’t more people investing in the equity markets? Interview the common person, and the top two answers will be inadequate knowledge of the investment world and the data analytics that goes into investing with a high probability of profitability.
Pacer Financial Inc. bridges this gap by providing exchange-traded funds that are client-focused and strategy-driven, which ensures mitigation against volatile markets.
Pacer ETFs: how do they work?
Pacer Financials Inc. has partnered with financial services companies and investment advisors to break down investment strategies into investment goals easily understood by common Joe. An ETF provider has become famous for its tailor-made exchange-traded funds, winning seven awards for its customer-centric offerings.
As such, Pacer ETFs comprise equities pooled together to achieve a particular investment objective and utilize a rule-based management methodology to mitigate against turbulent markets.
Top 5 Pacer ETFs for incredible profits
With Pacer ETFs, you don’t have to stress scouring through a mountain of data to identify ETFs that align with your investment strategy. Pacer ETFs catalogs ETFs into investment themes for easy decision making, with all their offerings structured to ensure low volatility while achieving more than average beta. The five Pacers ETFs below are the best for profitability among the Pacer exchange-traded fund portfolios.
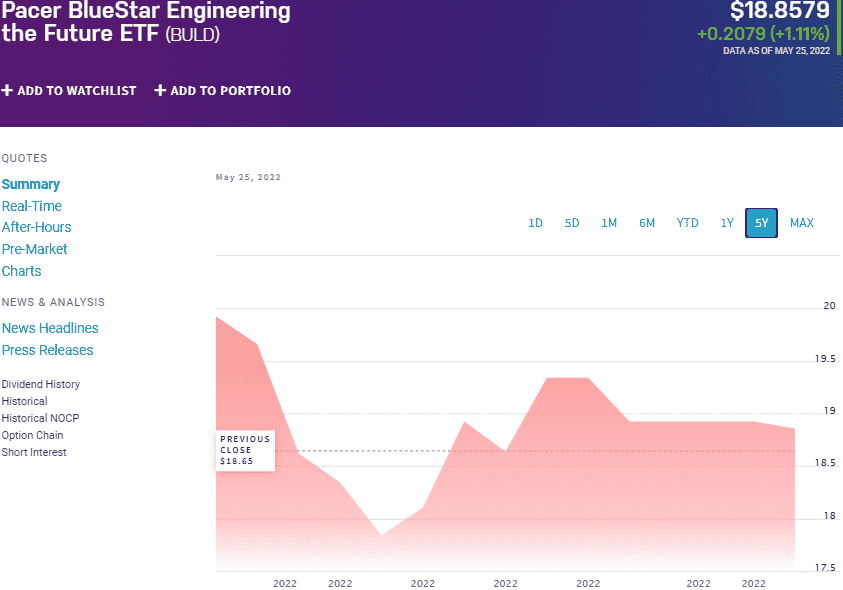
№ 1. Pacer Trendpilot US Large-Cap ETF (PTLC)
Price: $37.53
Expense ratio: 0.60%
Dividend yield: 0.86%
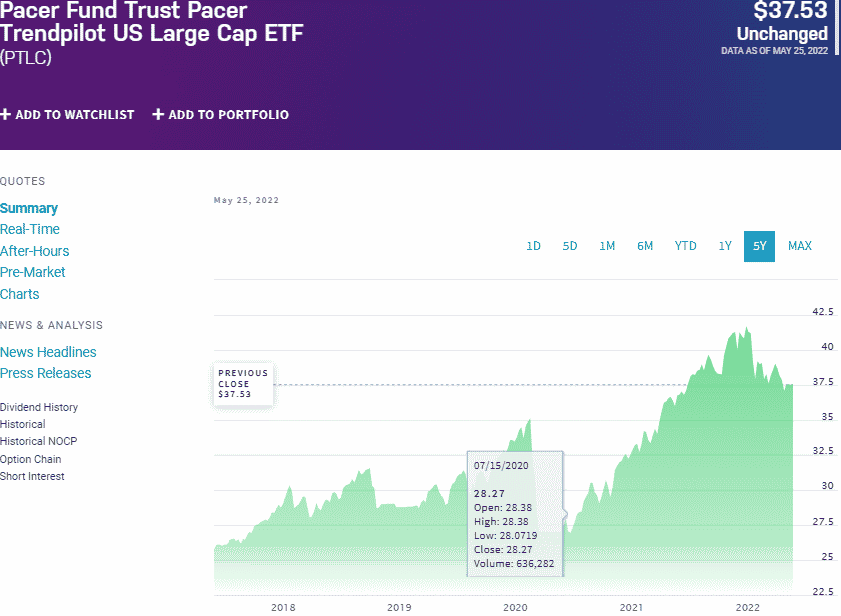
PTLC chart
The most popular fund follow the investment world trend of trusting in established blue-chip companies for long-term investing. The Pacer Trendpilot US Large-Cap ETF tracks the total returns performance of the Pacer Trendpilot US Large Cap Index, net of expenses and fees. To ensure minimal returns deviation, it invests at least 80% of its total assets in the components of its tracked index. It exposes investors to investment assets linked to the S&P 500 equities and treasury bills that ensure objective trends following investment strategy.
PTLC ETF is ranked № 58 by US News among 231 of the best large blend exchange-traded funds for long-term investing.
The top three holdings of this pacer ETF are:
- The United States Treasury Bills 0.0% 21-JUL-2022 – 47.05%
- The United States Treasury Bills 0.0% 04-AUG-2022 – 45.60%
- US Dollar – 7.35%
The PTLC ETF has $1.88 billion in assets under management, with an expense ratio of 0.60%. How many ETFs do you know combining maximization of upside potential while taming any unforeseen downturn?
This challenge is precisely what this ETF does by switching its weighting between the S&P 500 index and 3-month treasury bills. The result is a fund capable of weathering market downturn while maximizing all upside potential; 5-year returns of 53.55, 3-year returns of 31.70%, 1-year returns of 3.04%, and a dividend yield of 0.86%.
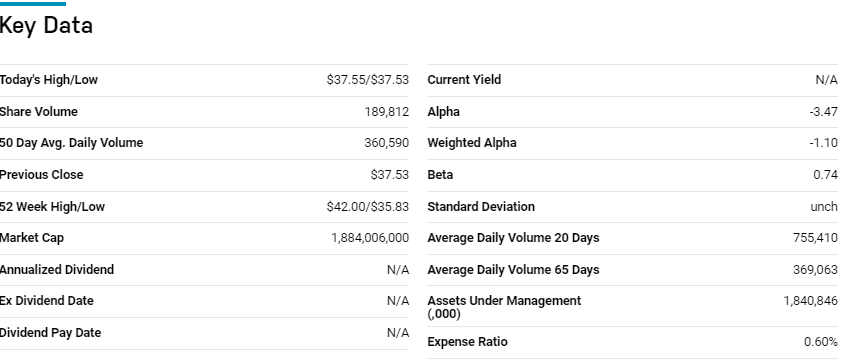
№ 2. Pacer Bluestar Engineering the Future ETF (BULD)
Price: $18.85
Expense ratio: 0.60%
Dividend yield: 0.57%
BULD chart
Since the industrial revolution, industrialists have taken the earth’s environment to the dog, pollution-wise. However, advancements in technology, the global appetite for green energy, and zero emissions have resulted in the industrial sector’s race for operational efficiency. The result has been the widespread adoption of automation and robotics.
Pacer Inc. exposes investors to this new age industrial revolution via the Pacer Bluestar Engineering the Future ETF, which tracks the BlueStar Robotics and 3D Printing Index, net expenses, and fees. It utilizes a replication strategy, investing all of its assets in its composite index and associated depository receipts, exposing investors to global organizations operating in robotics, manufacturing automation, and 3D printing.
The top three holdings of this transportation ETF are:
- ASML Holding NV ADR – 8.57%
- Autodesk, Inc. – 7.54%
- Dassault Systemes SA – 7.35%
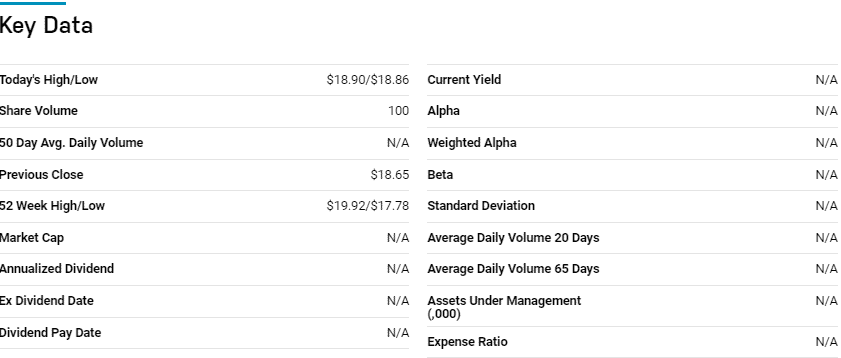
The BULD ETF is a new offering by pacer and, in less than a month, has amassed $1.1 million in assets under management, with investors’ parting with $60 annually for every $10000 invested. This fund is a diversified play on the fourth industrial revolution by incorporating equities from the entire value chain, driving this change.
A single equity weight cap of 8% provides a pretty even weighting mitigating against concentration risk. Being a new offering, the BULD ETF offers significant upside potential as robotics and manufacturing automation accelerates.
№ 3. Pacer Trendpilot International ETF (PTIN)
Price: $24.36
Expense ratio: 0.65%
Dividend yield: 0.68%
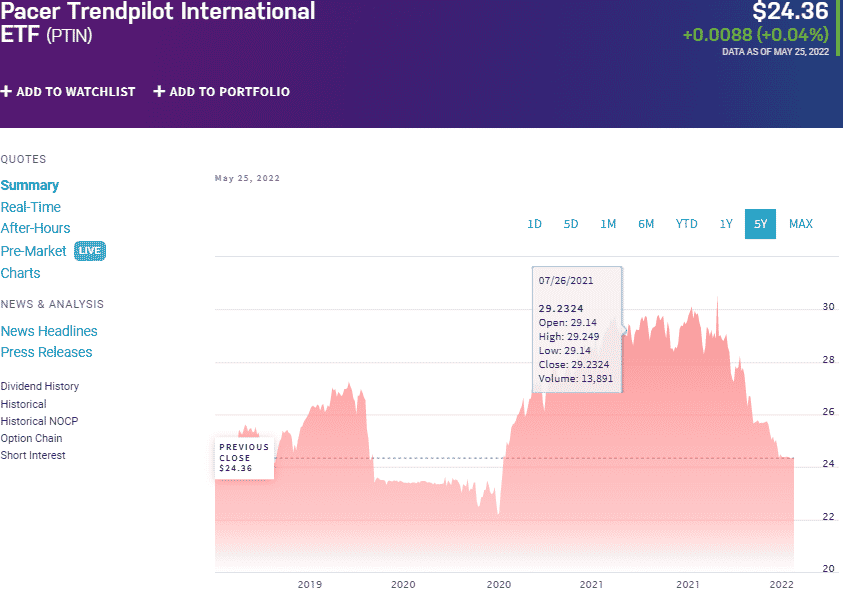
PTIN chart
Wall Street equities are not the only investment option, and Pacer Inc. understands the need for geographical diversification. Investors gain global exposure by investing in the Pacer Trendpilot International ETF. It tracks the total return performance of the Pacer Trendpilot International Index, investing at least 80% of its total assets in the holdings of the tracked index and other investment assets of like economic characteristics.
The top three holdings of this non-diversified pacer ETF are:
- The United States Treasury Bills 0.0% 21-JUL-2022 – 47.69%
- The United States Treasury Bills 0.0% 04-AUG-2022 – 39.72%
- The United States Treasury Bills 0.0% 18-AUG-2022 – 7.94%
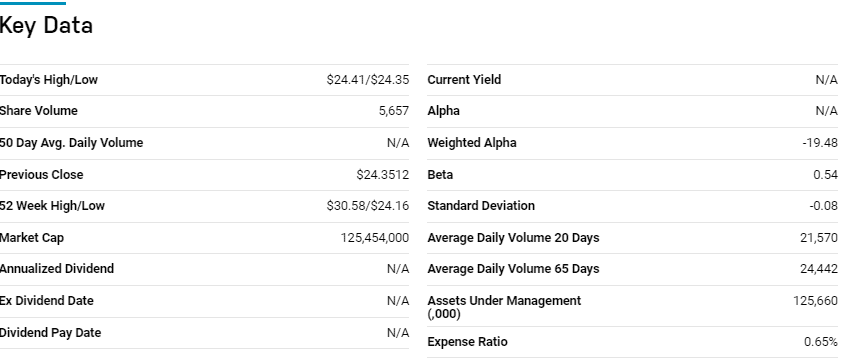
The PTIN ETF has $125.6 million in assets under management, with an expense ratio of 0.65%. This ETF is the second pacer offering to combine maximization of upside potential while taming any unforeseen downturn by switching its weighting between the S&P Developed Ex-US.
Large-Cap Index and 3-month US treasury bills, this fund ensure resilience to weather market downturn while maximizing all upside potential; 3-year returns of 4.48%, 1-year returns of 14.20%, and a dividend yield of 0.68%.
№ 4. Pacer Wealth Shield ETF (PWS)
Price: $30.40
Expense ratio: 0.60%
Dividend yield: 0.81%
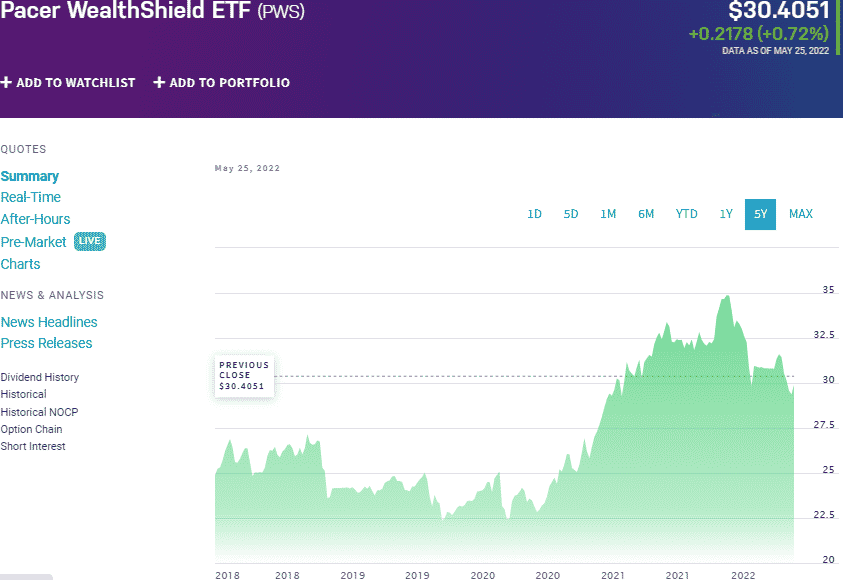
PWS chart
The Pacer Wealth Shield ETF tracks the total investment results of the Pacer Trendpilot International Index, net of expenses and fees. It invests at least 80% of its total assets in the composite index holdings to ensure minimum returns, and other investment assets exhibit economic characteristics.
The top three holdings of this non-diversified ETF are:
- Exxon Mobil Corporation – 5.54%
- Chevron Corporation – 4.62%
- Linde plc – 3.34%
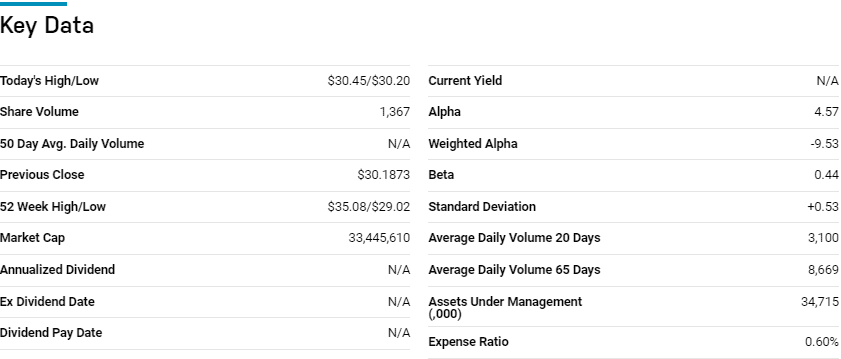
The PWS ETF has $32.9 million in assets under management, with an expense ratio of 0.60%. This ETF is a complex build between US treasury bonds, US equities, and US treasury bills. The guiding indicator is the risk ratio, which identifies the market sentiments via a proprietary methodology developed by Index Design Group, a subsidiary of Pacer Inc.
It helps switch from one investment asset to the other for enhanced profitability. The result is a highly malleable fund with the ability to maximize profits in almost all market conditions; 3- year returns of 26.53%, 1-year returns of -7.15%, and a dividend yield of 0.81%.
№ 5. Pacer Global Cash Cows Dividend ETF (GCOW)
Price: $33.94
Expense ratio: 0.60%
Annual dividend yield: 4.38%
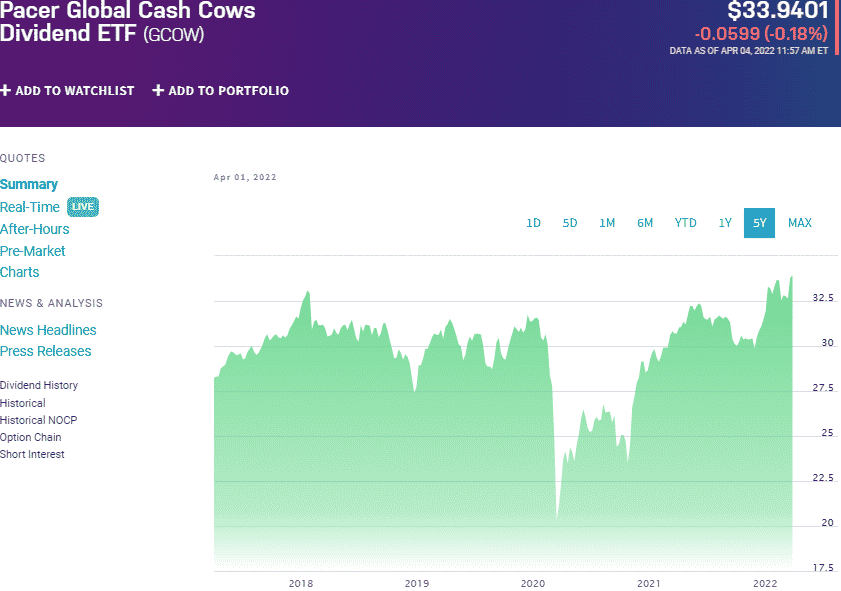
GCOW chart
Pacer Inc has an income option for investors in the Pacer Global Cash Cows Dividend ETF to navigate markets characterized by return erosion and high volatility. This fund tracks the total return performance of the Pacer Global Cash Cows Dividend Index, net of expenses, and fees.
To ensure minimal deviation, it invests at least 80% of its total assets, excluding collateral securities, in the tracked index underlying holdings and other investment securities exhibiting similar economic characteristics. It exposes investors to the most liquid 100 global companies featuring a history of high dividend yield and free cash flow yield.
The top three holdings of this global large-cap value ETF are:
- Exxon Mobil Corporation – 2.73%
- Chevron Corporation – 2.65%
- Shell PLC Sponsored ADR – 2.45%
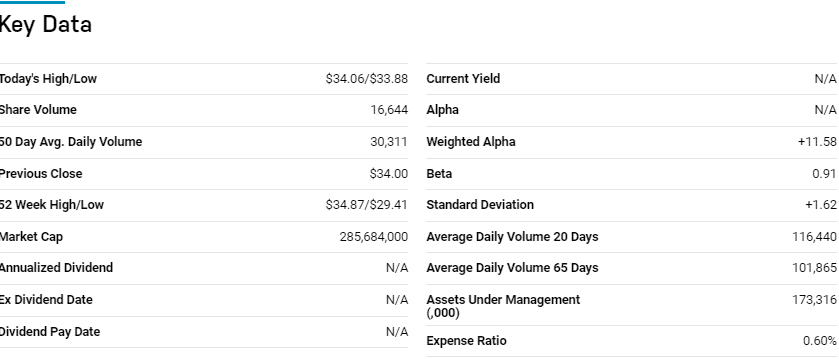
The GCOW ETF has $429.5 million in assets under management, with an expense ratio of 0.60%. This fund uses a proprietary multi-step equity screening methodology; the first step screens for the best 300 developed markets’ global equities on consistent dividend payout with the best positive cashflows.
The second step screens these 300 finalists on their dividend yields to come up with the top 100 high dividend yields. The result is a fund that provides geographical diversification and consistent growth and value creation; 5-year returns of 42.63%, 3-year returns of 32.15%, 1-year returns of 12.43%, and more than the decent annual dividend yield of 4.38%.
Final thoughts
The choice of ETF provider is highly individualistic depending on the investment strategy. Pacer Inc provides customer-focused exchange-traded funds, and the five above are ahead of the pack in their respective investment geography, with a high probability of enhanced profitability.


Comments