
Despite a heavy reliance on North Korea for imports and the existing geopolitical tensions between North and South Korea, the region is one of the fastest-growing economies globally.
In addition, South Korea is ranked among the fastest economies in post-pandemic resurgence. This accelerated resurgence is attributable to a time-tested hybrid economy system, combining personal freedom with centralized planning and government regulation. The result is a consumer-savvy populace willing to spend on quality products, a stable economy, high levels of disposable income, solid international positioning, and a free economy that encourages investment.
How do you gain exposure to one of the Four Asian Tigers’ economies? Exchange-traded funds with Korean exposure.
What is the composition of Korean ETFs?
Korean ETFs comprise either equities solely domiciled in South Korea, a combination of equities domiciled in Korea and those that draw significant revenues from the Korean economy, or those with significant resources invested in the Korean economy.
Top 7 Korean ETFs
Along with Taiwan, Hong Kong, and Singapore, Korea is known for rapid economic expansion and has been a member of the Four Asian Tigers economy. Despite its economy shrinking to its worst level in four decades, the hybrid financial system facilitated Korea taking advantage of the cessation of movement to boaster its exports by 9.27% and, as a result, pass the 4% economic expansion mark the highest in 11 years for 2021.
2022 is expected to bring along more growth, and these seven Korean ETFs give you exposure and a chance at phenomenal returns in this emerging market economy.
iShares MSCI South Korea ETF (EWY)
Price: $68.73
Expense ratio: 0.57%
Dividend yield: 0.80%
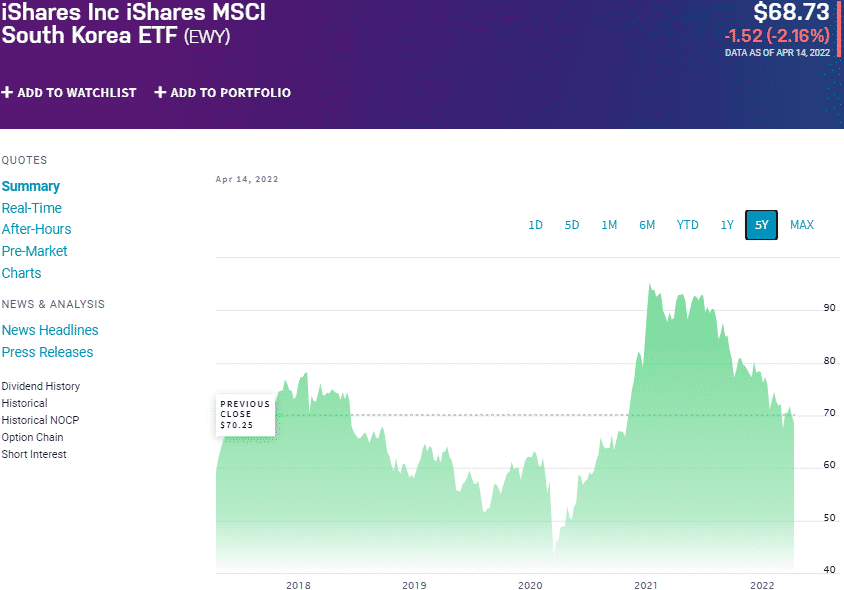
EWY chart
iShares MSCI South Korea ETF tracks the performance of the MSCI Korea 25/50 Index, investing at least 80% of its assets in the holdings of its composite index and investment assets of similar economic characteristics. It exposes investors to the mid-cap and large-cap Korean equity segments.
EWT ETF is ranked № 31 by US News analysts among 77 of the best miscellaneous region funds for long-term investing.
The top three holdings of this fund are:
- Samsung Electronics Co., Ltd. – 20.68%
- SK Hynix Inc – 5.85%
- NAVER Corp. – 3.79%
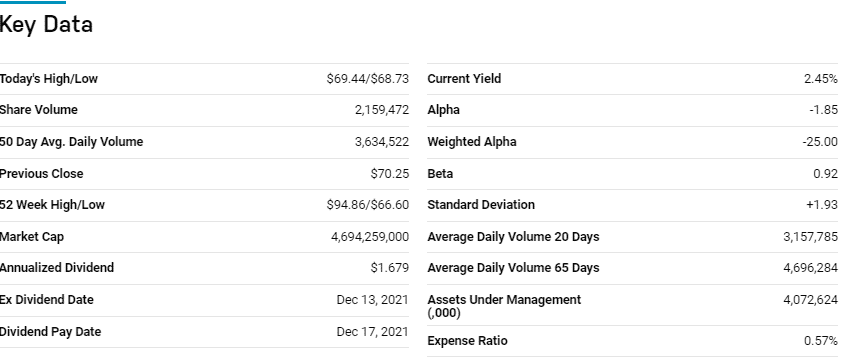
As the most liquid and popular ETF with Korean exposure, it comes as no surprise the asset under management that the EWY ETF controls $4.07, at an expense ratio of 0.57%. Except for the last 12 months, this Korean ETF has been a consistent revenue generator for its investor; 5-year returns of 29.16%, 3-year returns of 15.51%, and 1-year returns of -22.43%.
VanEck Vietnam ETF (VNM)
Price: $18.54
Expense ratio: 0.61%
Dividend yield: 0.34%
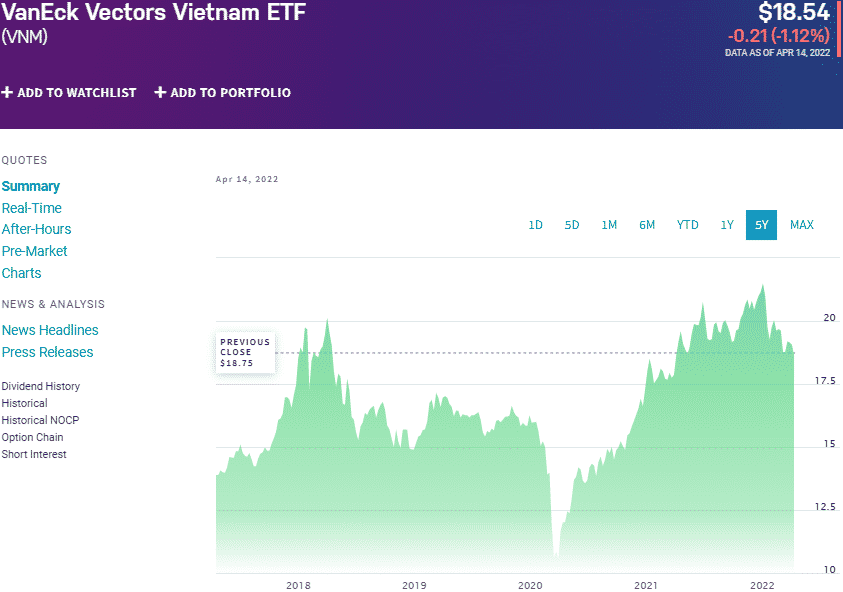
VNM chart
The VanEck Vietnam ETF tracks the performance of the MVIS Vietnam Index, investing at least 80% of its total assets in the holdings of the tracked index. It exposes investors to Korean and Vietnamese equities-domiciled in Vietnam or deriving at least 50% from Vietnam, or more than 50% of total asset allocation in Vietnam.
VNM ETF is ranked № 30 by USNews among 77 of the best miscellaneous regional funds for long-term investing.
The top three holdings of this non-diversified ETF are:
- Vingroup Joint Stock Company – 8.43%
- Hoa Phat Group JSC – 7.32%
- Vinhomes JSC – 6.98%
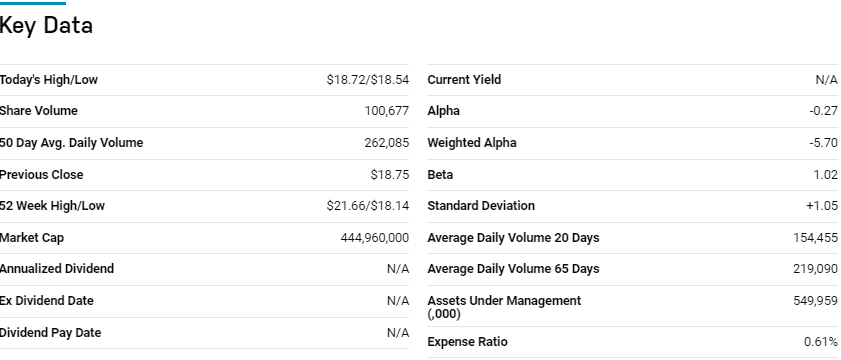
VNM ETF has $490.9 million in assets under management, with an expense ratio of 0.61%. Combining Vietnamese and Korean ETFs provides cross-border diversification, which mitigates country-specific risks. In addition, equities operating in a quasi-developed economy and those in an emerging market provide growth opportunities coupled with stability and hence value; 5-year returns of 37.96%, 3-year returns of 10.97%, and 1-year returns of 0.89%.
Franklin FTSE South Korea ETF (FLKR)
Price: $24.41
Expense ratio: 0.09%
Dividend yield: 1.75%
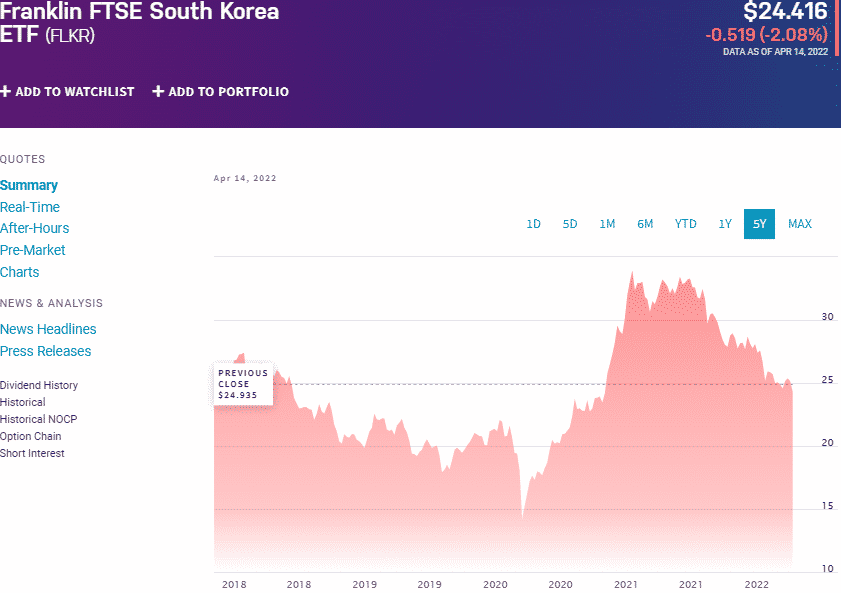
FLKR chart
Franklin FTSE South Korea ETF tracks the performance of the FTSE South Korea RIC Capped Index, investing at least 80% of its assets in the holdings of the tracked index, including depository receipts representative of the underlying holdings. It exposes investors to South Korea’s best large-cap and mid-cap equities domiciled in South Korea.
The top three holdings of this fund are:
- Samsung Electronics Co., Ltd. – 16.60%
- SK Hynix Inc – 6.24%
- NAVER Corp. – 4.57%
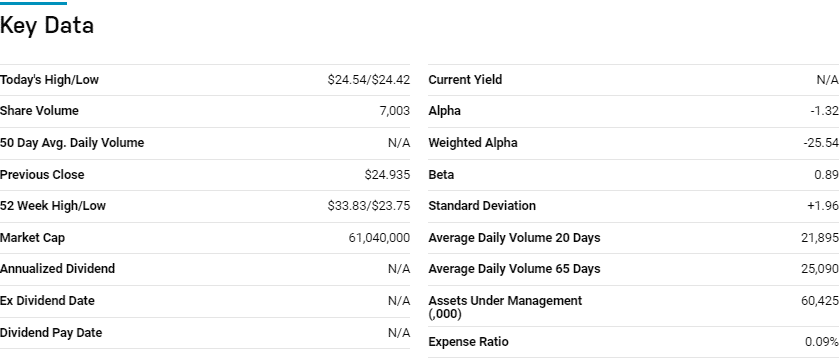
Despite the similarities with the EWY ETF, FLKR has meager assets under management, $60.4 million, but is quite the bargain for investors with an annual expense ratio of 0.09%. The last 12 months have not been kind to this Korean ETF, but given its history of returns and consistent income, it should be monitored closely; 3-year returns of 19.37%, 1-year returns of -22.86%, and a decent annual dividend yield of 1.75%.
First Trust Asia-Pacific ex-Japan AlphaDEX Fund (FPA)
Price: $30.76
Expense ratio: 0.80%
Annual dividend yield: 2.92%
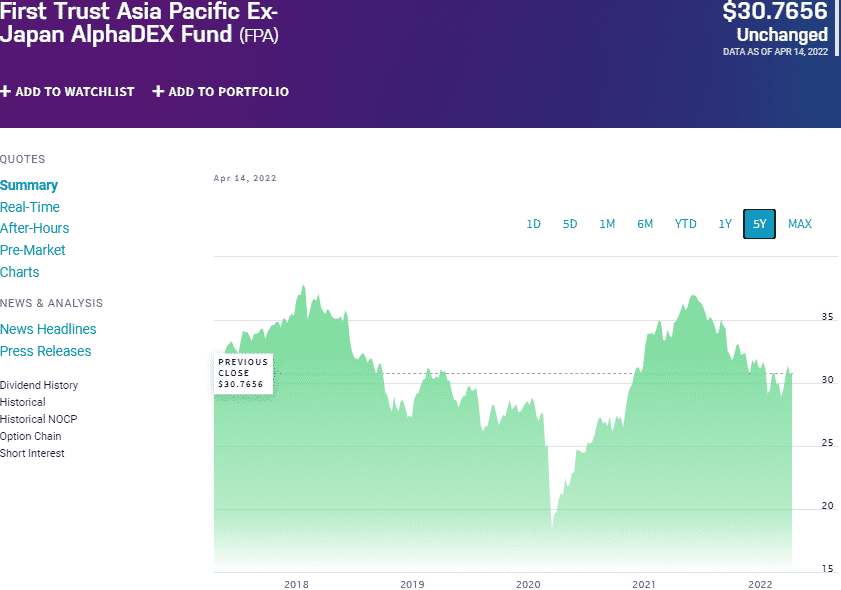
FPA chart
The First Trust Asia-Pacific ex-Japan AlphaDEX Fund tracks the performance of the NASDAQ AlphaDEX Asia Pacific Ex-Japan Index, net of expenses and fees. FPA invests at least 90% of its total assets in the holdings of the tracked index and REITs and ADRs associated with the composite index. It exposes its investors to Asia/Pacific equities, ex-Japan, chosen via the AlphaDex methodology to generate positive alpha, ensuring risk-adjusted returns.
The top three holdings of this non-diversified ETF are:
- Hopson Development Holdings Limited – 1.83%
- Korea Zinc Co., Ltd. – 1.74%
- Ampol Limited – 1.71%
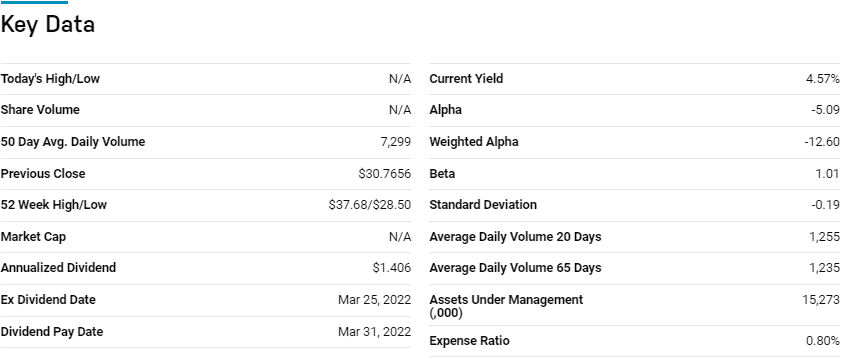
The FPA ETF has $15.3 million in assets under management, with an expense ratio of 0.80%. Quant-based screening for stocks that have the best potential for generating positive alpha and outperforming the broader markets results in a fund that provides both value and growth attributes consistently; 5-year returns of 19.73%, 3-year returns of 10.70%, 1-year returns of -5.97%, and a decent dividend yield of 2.92%.
Freedom 100 Emerging Markets ETF (FRDM)
Price: $32.76
Expense ratio: 0.49%
Dividend yield: 1.04%
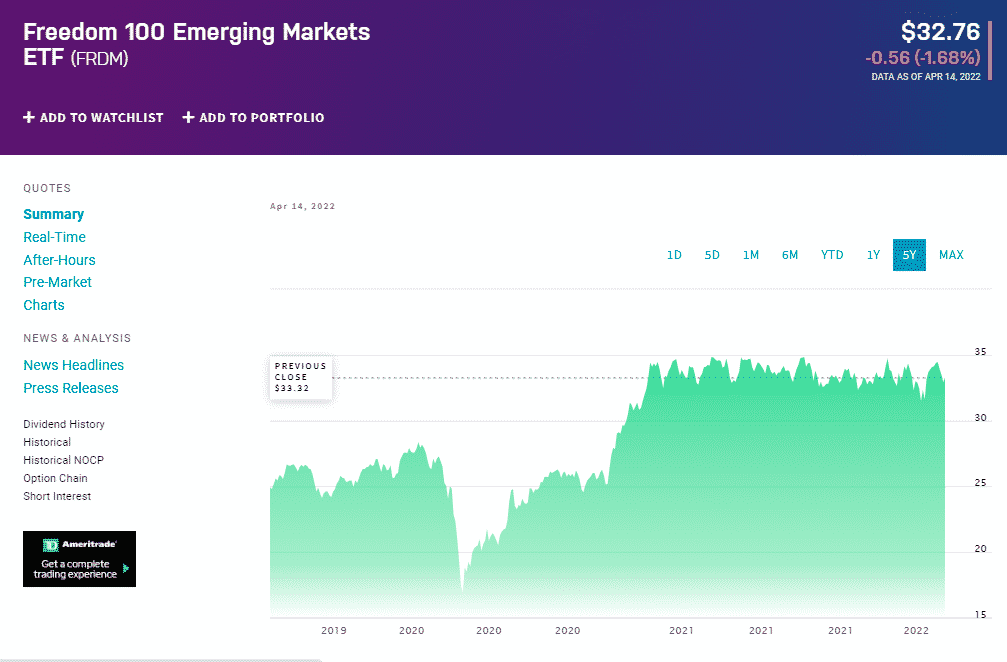
FRDM chart
The Freedom 100 Emerging Markets ETF tracks the total return performance of the Freedom 100 Emerging Markets Index, net of expenses, and fees. It invests at least 80% in its underlying index, associated depository receipts, and ADRs, exposing investors to 100 of the best equities in emerging markets.
The top three holdings of this fund are:
- Samsung Electronics Co., Ltd. – 6.95%
- Taiwan Semiconductor Manufacturing Co., Ltd. – 6.35%
- Sociedad Quimica Y Minera De Chile S.A. Sponsored ADR Pfd Class B – 6.29%
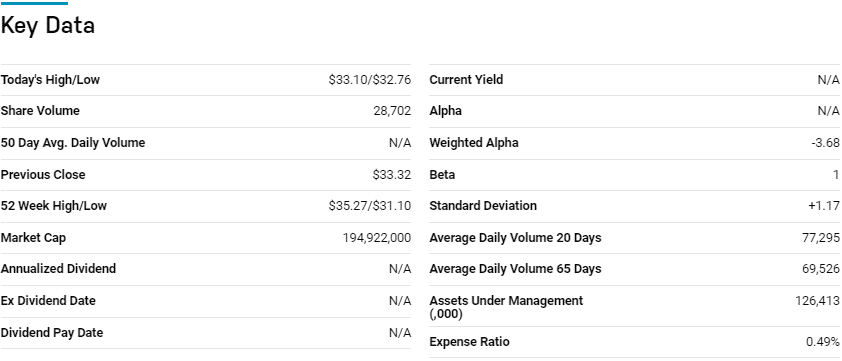
The FRDM ETF has $195.3 million in assets under management, with an expense ratio of 0.49%. Despite launching in late 2019, at the beginning of the coronavirus pandemic, this ETF is on the verge of posting positive returns. This might be attributable to its thorough holding screening that considers 76 indicators, qualitative, quantitative, and economic metrics. It also solves the challenge of geopolitical risk due to state ownership of equities in emerging markets by capping this to 20% and below.
iShares Asia 50 ETF (AIA)
Price: $66.05
Expense ratio: 0.50%
Dividend yield: 1.42%
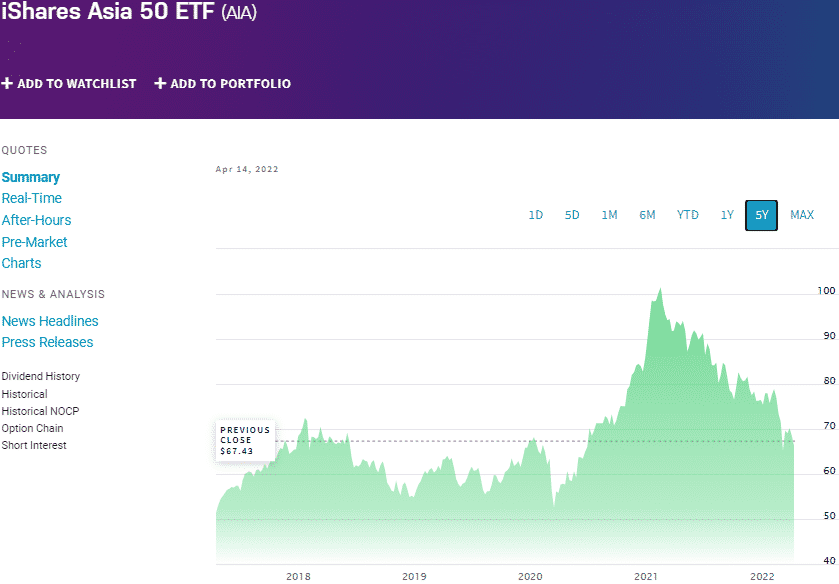
AIA price chart
The iShares Asia 50 ETF tracks the performance of the S&P Asia 50TM, investing at least 80% in its underlying index and investment assets of similar economic characteristics. The remaining 20% is invested in financial instruments that are believed to mimic the performance of the composite index. It exposes investors to the top 50 equities domiciled in the Four Asian Tigers economies.
Among 12 of the best Asia/Pacific equities, ex-Japan, USNews has the AIA ETF at No 4 for long-term investing.
The top three holdings of this fund are:
- Taiwan Semiconductor Manufacturing Co., Ltd. – 13.99%
- Tencent Holdings Ltd. – 10.89%
- Samsung Electronics Co., Ltd. – 10.79%
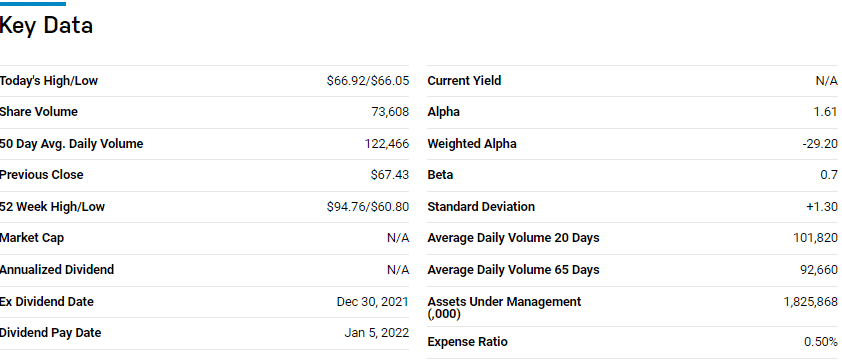
The AIA ETF has $1.82 billion in assets under management, with an expense ratio of 0.50%. Despite exposure to only large-cap equities, the rapid economic expansion of these Asian Tiger Economies provides both value and growth opportunities for investors in this fund; 5-year returns of 40.72%, 3-year returns of 11.16%, 1-year returns of -26.69%, and a decent annual dividend yield of 1.42%.
VictoryShares USAA MSCI Emerging Markets Value Momentum Fund (UEVM)
Price: $46.82
Expense ratio: 0.45%
Dividend yield: 3.86%
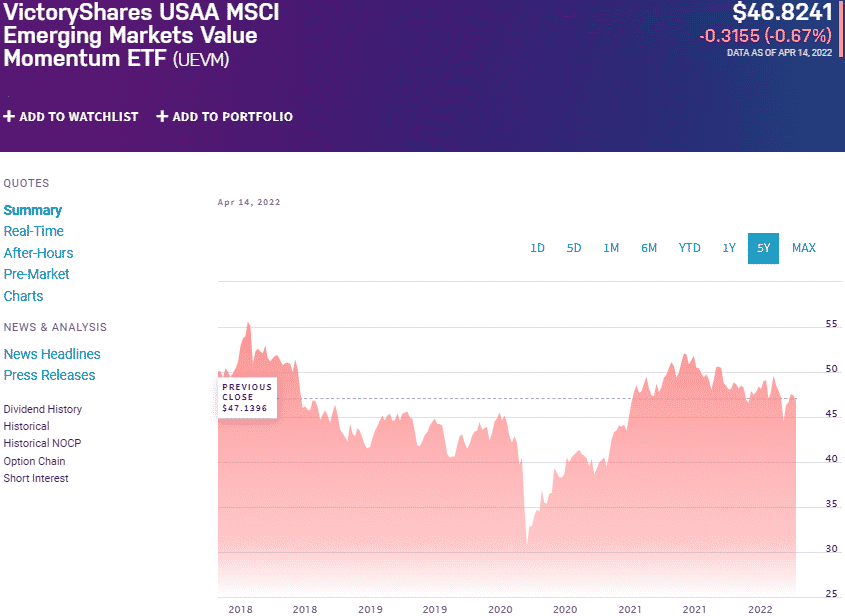
UEVM chart
VictoryShares USAA MSCI Emerging Markets Value Momentum Fund tracks the MSCI Emerging Markets Pros-China Index’s performance, investing at least 80% in its underlying index and associated depository receipts. It exposes investors to core emerging market equities, offering both growth and value across the cap divide.
Among the best 84 diversified emerging market funds, USNews has the UEVM ETF at No 18 for long-term investing.
The top three holdings of this fund are:
- Telefonica Brasil S.A. – 1.03%
- Emirates Telecommunications Group Company PJSC – 1.02%
- Synnex Technology International Corp. – 1.02%
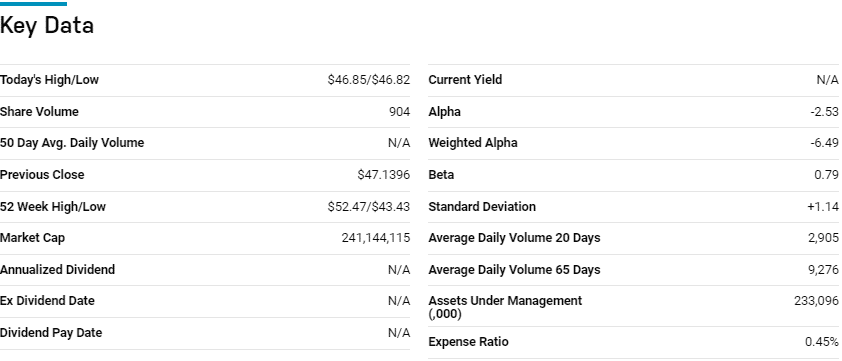
The UEVM ETF has $238.6 million in assets under management, with an expense ratio of 0.45%. Picking the top 25% equities in different sectors provides not only diversification but a resilient fund capable of riding out market downturns to provide both value and growth; 3-year returns of 12.85%, 1-year returns of 0.28%, and a more than the average annual dividend yield of 3.86% for good measure.
Final thoughts
The South Korean equities have historically underperformed the US equities. Still, the ability of this economy to quickly bounce back from the coronavirus pandemic is a testament to the robustness of this economy. Coupled with these, the current insatiable need for semi-conductors globally and the rising global demand for consumer electronics, two segments forming a significant part of the Korean export industry, and the Korean ETFs above could provide geographical diversification and significant portfolio returns.


Comments