ETF full name: Global X Uranium ETF (URA)
Segment: Global Nuclear Energy
ETF provider: Mirae Asset Global Investment Company Ltd.
| URA key details | ||
| Issuer | Global X Management Company | |
| Dividend | 1.32% | |
| Inception date | 4th November 2010 | |
| Expense ratio | 0.69% | |
| Average Daily $ volume | $32.81 million | |
| Investment objective | Replication Strategy | |
| Investment geography | Global Nuclear Energy Equities | |
| Benchmark | DAXGlobal Nuclear Energy Index | |
| Weighted Average Market Cap | $9.03 billion | |
| Net Assets under Management | $933.84 million | |
| Number of holdings | 45 | |
| Weighting methodology | Weighted average market cap | |
About the URA ETF
Mention uranium, and automatically the first thing to come to mind is military nuclear might. Despite being heavily associated with nuclear weapons, uranium as a mineral has so many more uses. Especially in the modern world of renewable energy sources.
The International Atomic Energy Agency, IAEA, estimates that nuclear-generated electricity will double from 393 GW to 792 GW in the next three decades. This positive outlook is highly attributable to the changing perception of the globe on the use of uranium for nuclear-based electricity after successful adoption by France, Japan, and China.
It is also an energy source with a minimal carbon footprint with higher efficiency. One pound of uranium can generate power equivalent to 20000 pounds of coal.
Global nuclear power plants are increasing as developed and developing markets seek alternative energy sources other than fossil fuels. Thus, the uranium market is on the brink of critical mass.
Rather than pick individual uranium equities and time the market for movers, why not choose an exchange-traded fund that gives you exposure to the global uranium equity market? Global X Uranium ETF is one of the oldest pure-play uranium ETFs, and its recent surge shows its strategic positioning to take advantage of the positive uranium outlook.
URA Fact-set analytics insight
Global X Uranium ETF tracks the Solactive Global Uranium and Nuclear Components Index. Before 2018, the URA ETF tracked the Solactive Global Uranium Index.
Through the composite index, URA exposes investors to the global uranium and nuclear energy market. It invests in holdings that explore, mine and refine uranium, organizations that manufacture equipment. Besides, it invests in components for uranium and nuclear-based firms and organizations deriving a large portion of their total revenues from uranium and nuclear-related activities. 80% of these investments are in holdings of the tracked index, ADRs, and GDRs making it a non-diversified fund.
URA performance analysis
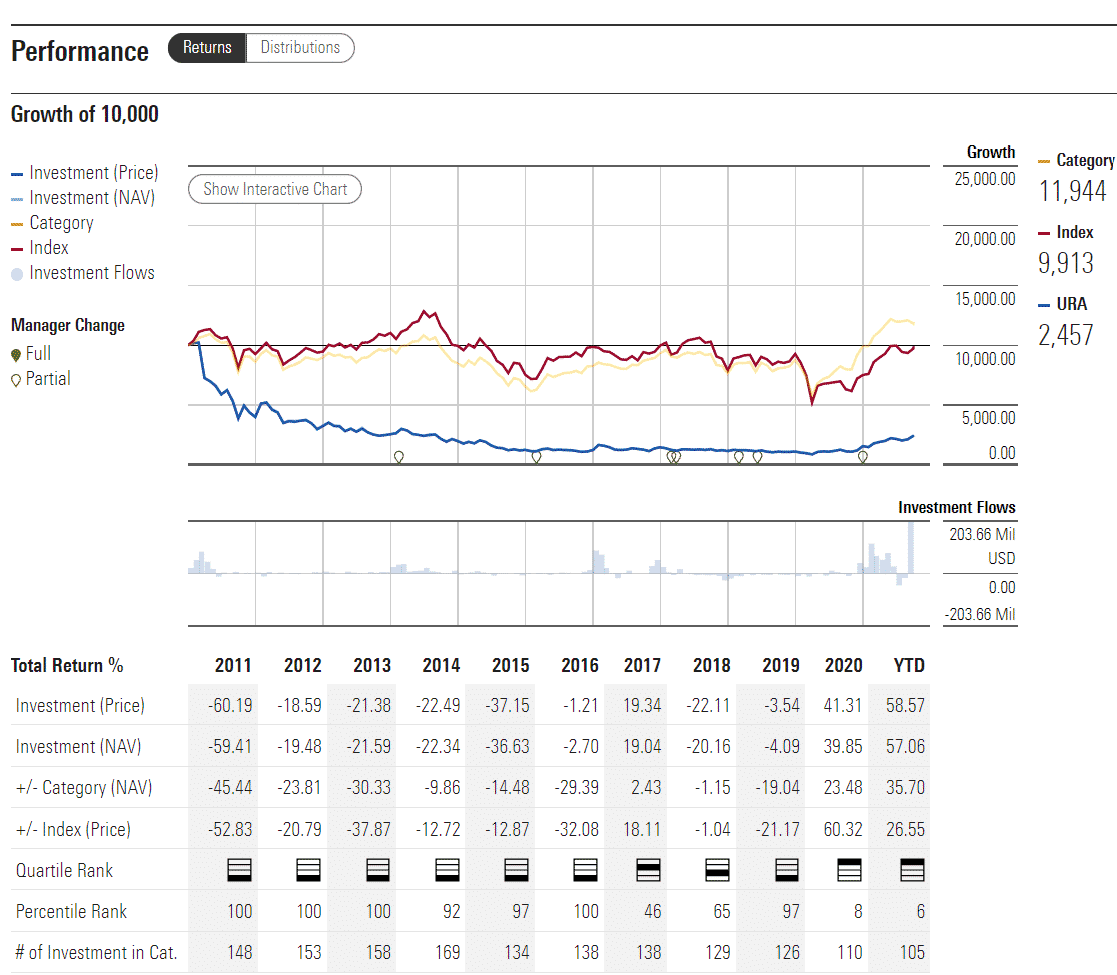
A glance at the chart above shows URA ETF has been a consistent performer, except in 2021, when the mines shut down due to the coronavirus pandemic. As the clean energy efforts intensified globally, scientists found a way to harness the deadly uranium, formerly known for nuclear weaponry, to a source of clean and efficient energy, with room for scalability at very minimal greenhouse gas emissions.
A look at the historical performance shows that nuclear power and the uranium space is no longer just statistics but a viable option for investors to mint serious bucks, and with a clean conscience; 5-year returns-112.87%, 3-year returns-90.35%, and pandemic year returns of 126.75%.
URA ETF RATING |
|||||
| Resource | ETF DATABASE | ETF.com | MarketWatch.com | Morningstar.com | Money.usnews.com |
| IPO Rating | A+ | N/A | Quantile 1 | ** | #20 |
| IPO ESG Rating | N/A | N/A | N/A | 35.76 out of 50 | 3/10 |
URA key holdings
Starting with only 25 holdings during inception, URA evolved to accommodate the ever-growing uranium and nuclear energy market to include 45 organizations across the developed and emerging economies.
Despite the expanded holding base, URA still holds a bias towards the world-leading uranium and nuclear organizations, making it highly volatile compared to a standard exchange-traded fund-concentration risk.
The top ten uranium and nuclear energy ETFs holdings account for 64.11% of the weighting and areas below.
| Ticker | Holding name | % of assets |
| CCO | Cameco Corp. | 22.38% |
| KAP | National Atomic Company Kazatomprom JSC Sponsored GDR RegS | 9.92% |
| NXE | NexGen Energy Ltd | 7.73% |
| PDN | Paladin Energy Ltd | 5.97% |
| DML | Denison Mines Corp. | 4.72% |
| EFR | Energy Fuels Inc. | 3.66% |
| YCA | Yellow Cake Plc. | 2.95% |
| UEC | Uranium Energy Corp. | 2.79% |
| 1816 | CGN Power Co., Ltd. Class H | 2.18% |
| MQG | Macquarie Group Limited | 1.81% |
URA reconstitutes its holding-base semi-annually to ensure it stays true to its investment objectives.
Industry outlook
As the thirst for clean energy picks up pace globally, nuclear energy has shown to have the capacity to power the next phase of human evolution at a relatively low cost.
Investorplace analysts reckon that as central authorities focus more on low carbon emission energy sources, nuclear power gains more traction creating a long-term bullish outlook for uranium equities.
In addition, Barclays shed light on the perception that nuclear power is dangerous, given historical mishaps, showing that gravity, convention, and heat to protect the core instead of using a power-dependent system made its generation safe.
With 53 new nuclear reactors in different project completion rates worldwide, URA is on the brink of nuclear gains as this niche attains critical mass and explodes-year-to-date returns so far of 58.54%.












Comments