
Talk about developed economies, and South Korea is bound to pop up in that discussion. It is the tenth best economy globally and the fourth largest in Asia. It has an economic freedom score of 74.0, making it the twenty-fourth freest economy globally. Despite the economy being a hybrid system that combines personal freedom with centralized planning and government regulation, these rankings are.
Post-pandemic, South Korea has continued coupling rapid economic growth with poverty reduction and is among the fastest recovering economies globally. To cash on this accelerated recovery, the exchange-traded funds below expose you to either the entire South Korean economy or a specific sector.
What is the composition of South Korean ETFs?
How do you define an exchange-traded fund? It is a basket of like investment assets economically, trading as one instrument. With this in mind, South Korean ETFs then comprise a combination of investment assets solely domiciled in South Korea and those with significant assets or drawing significant revenues off the South Korean economy. As a result, this list will include exchange-traded funds with significant exposure to the South Korean economy.
Top 7 South Korean ETFs
Riding on the tailwinds of the Covid-19 virus, the South Korean environment contracted to post negative growth in 2020. However, efficient management of the system saw this economy recover early enough to take advantage of border locked manufacturing countries of semi-conductors and other materials to grow exports by 9.27% and propel this economy to its largest growth in 11 years.
Despite the spread of the Omicron Covid-19 virus variant, the Bank of Korea has raised its rates to pre-pandemic levels, 1.25%, to deal with inflationary pressures and spur the next phase of its economic resurgence. The ETFs below give investors access to this upbeat, fast-paced economy on the road to full economic resurgence.
iShares MSCI South Korea ETF (EWY)
Price: $73.10
Expense ratio: 0.59%
Dividend yield: 0.80%
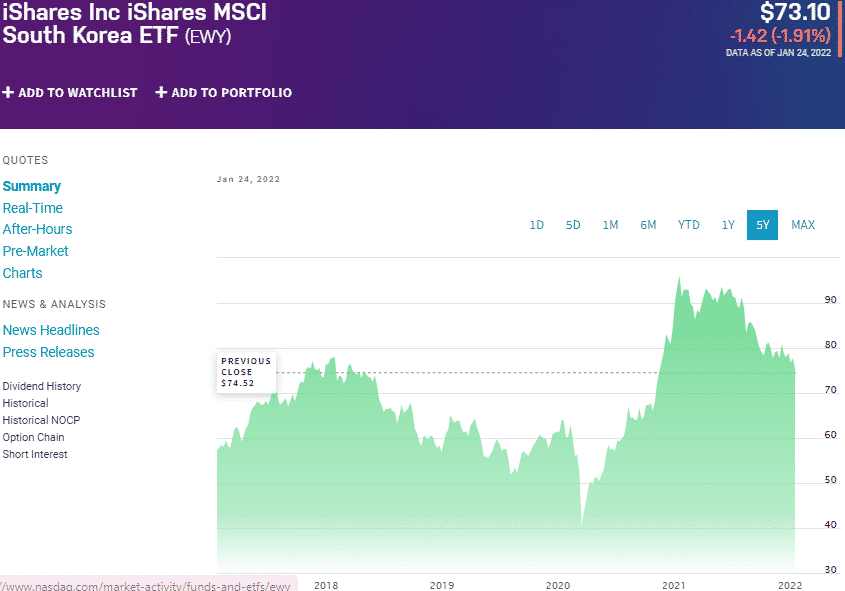
EWY price chart
iShares MSCI South Korea ETF tracks the MSCI Korea 25/50 Index, investing at least 80% of its assets in the holdings of its composite index, coupled with investment assets that have similar economic characteristics to those of the tracked-index holdings.
The EWY is a non-diversified fund exposing investors to the large-cap and mid-cap equities, with significant interests in this hybrid system economy.
EWT ETF is ranked № 33 by US News analysts among 78 of the best miscellaneous region funds for long-term investing.
The top three holdings of this fund are:
- Samsung Electronics Co., Ltd. – 24.62%
- SK Hynix Inc – 6.24%
- NAVER Corp. – 3.82%
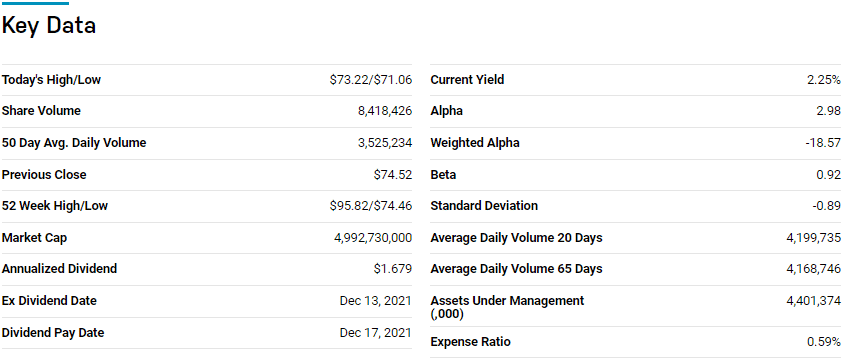
EWY ETF boasts $4.4 billion in assets under management, with an expense ratio of 0.59%. Except for 2021, the last half a decade has been a solid period for ETF and its investors; 5-year returns of 45.64%, 3-year returns of 27.52%, and 1-year returns of -20.76%. The composition blend of large and mid-cap equities and the fact that the EWY is deep put on a strong case to buy the deep and ride the resulting bullish run as this economy recovers from Covid-19.
Franklin FTSE South Korea ETF (FLKR)
Price: $25.78
Expense ratio: 0.09%
Dividend yield: 1.75%
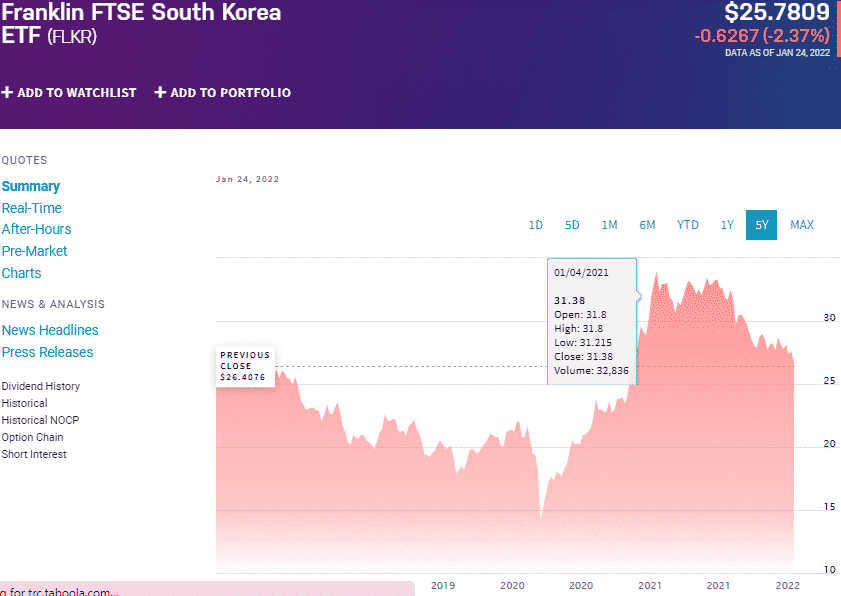
FLKR price chart
Franklin FTSE South Korea ETF tracks the FTSE South Korea RIC Capped Index, investing, under normal conditions, at least 80% of its assets in the holdings of its composite index and depository receipts representative of the underlying holdings. Like the EWY, this South Korean fund exposes investors to the best large-cap and mid-cap equities domiciled in South Korea.
The top three holdings of this fund are:
- Samsung Electronics Co., Ltd. – 18.02%
- SK Hynix Inc – 6.70%
- NAVER Corp. – 4.67%
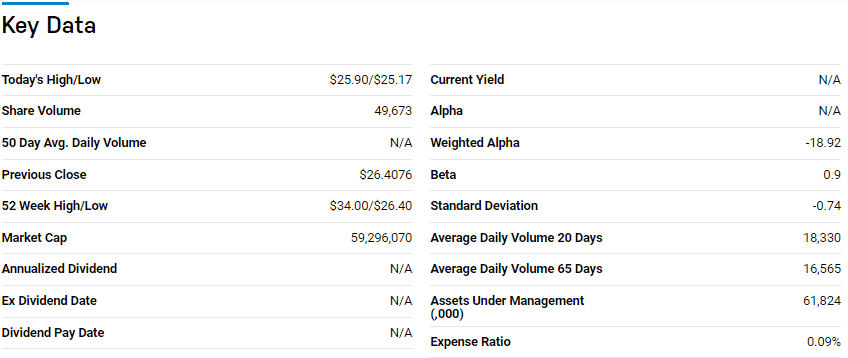
The FLKR has meager assets under management than the EWY at $61.8 million but is a much cheaper option to own at an expense ratio of 0.09%. Despite having launched much later than the EWY, this South Korean fund has matched the former’s performance almost to a tee; 3-year returns of 30.51% and 1-year returns of -20.69%.
However, having a heavier concentration on mid-cap equities, the FLKR exposes investors to more upside potential than the more liquid EWY. In addition, at a dividend yield of 1.75%, it combines returns with regular and consistent income.
VanEck Vietnam ETF (VNM)
Price: $19.12
Expense ratio: 0.61%
Dividend yield: 0.34%
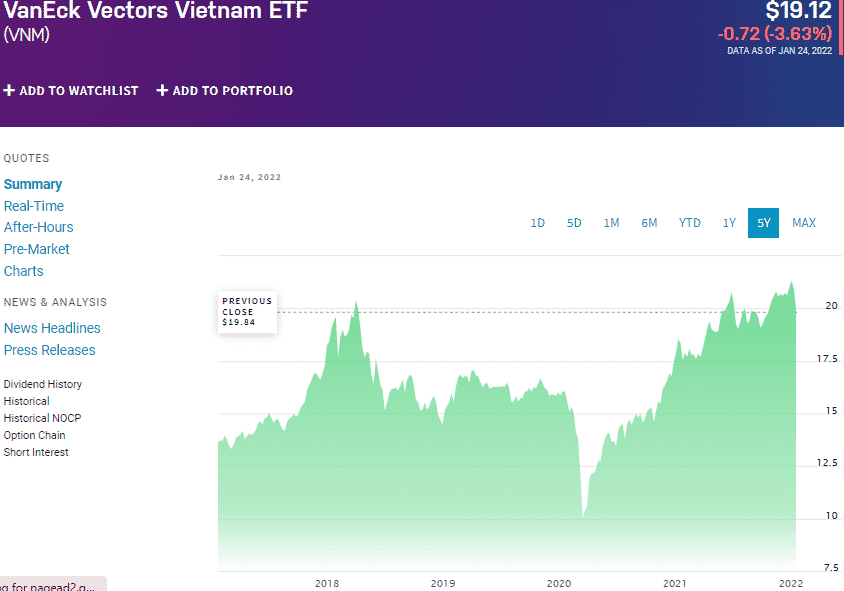
VNM price chart
The VanEck Vietnam ETF tracks the MVIS® Vietnam Index, investing at least 80% of its total assets in the underlying holdings of the composite index. IN VIETNAM, the VNM exposes South Korean firms and other firms with significant interests, at least 50% revenue generation or asset allocation.
VNM ETF is ranked № 13 by US News analysts among 78 of the best miscellaneous regional funds for long-term investing.
The top three holdings of this non-diversified ETF are:
- Vinhomes JSC – 8.07%
- Vingroup Joint Stock Company – 7.46%
- Masan Group Corporation – 7.19%
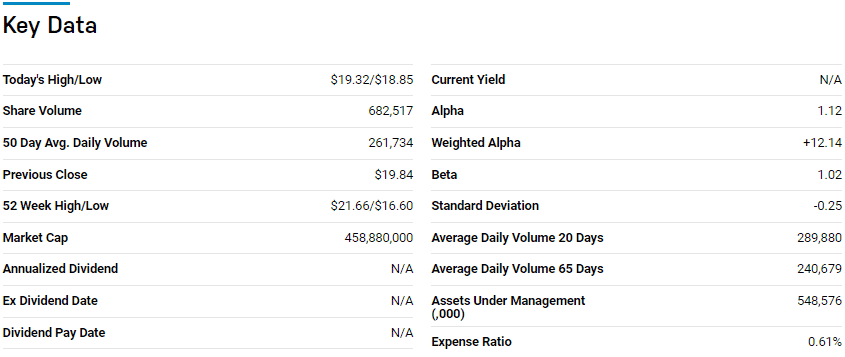
VNM ETF has $554 million in assets under management, with an expense ratio of 0.61%. Boasting cheap labor cost and a manufacturing hub to rival China now that there are trade tensions of the later with the USA, this fund provides geographical diversity to South Korea, reducing concentration risk. The combination of a quasi-developed economy, South Korea, and an emerging market. Vietnam provides both portfolio value and growth, as evidenced by historical returns; 5-year returns of 54.54%, 3-year returns of 30.40%, and 1-year returns of 8.53%.
First Trust Asia-Pacific ex-Japan AlphaDEX Fund (FPA)
Price: $29.73
Expense ratio: 0.80%
Annual dividend yield: 2.92%
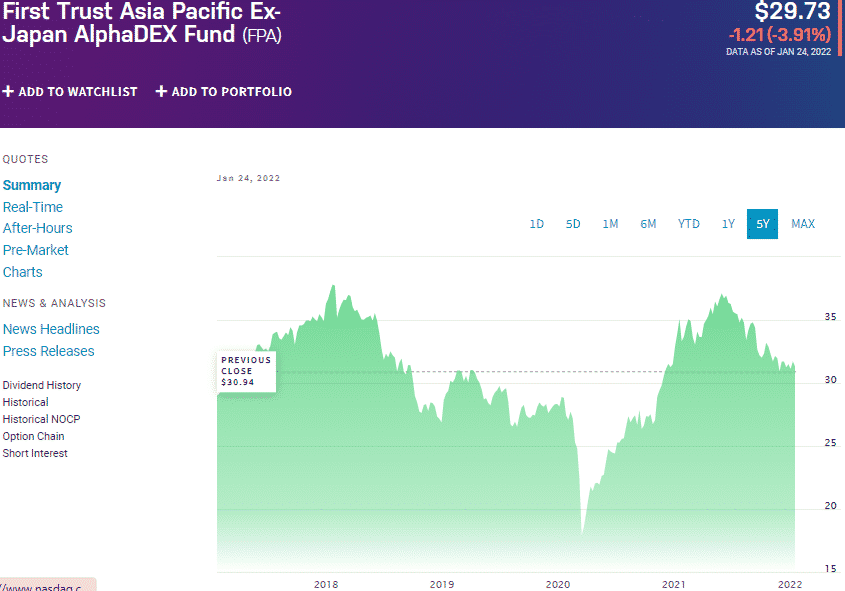
FPA price chart
The First Trust Asia-Pacific ex-Japan AlphaDEX Fund seeks to replicate the performance of the NASDAQ AlphaDEX® Asia Pacific Ex-Japan Index, net of expenses and fees. FPA invests at least 90% of its total assets in the underlying holdings of its composite index, in addition to REITs and ADRs coupled to the underlying holdings. It exposes its investors to equities chosen via the AlphaDex methodology to generate positive alpha, ensuring risk-adjusted returns.
The top three holdings of this non-diversified ETF are:
- Pilbara Minerals Limited – 2.91%
- Fortescue Metals Group Ltd – 2.37%
- Lynas Rare Earths Limited – 2.06%
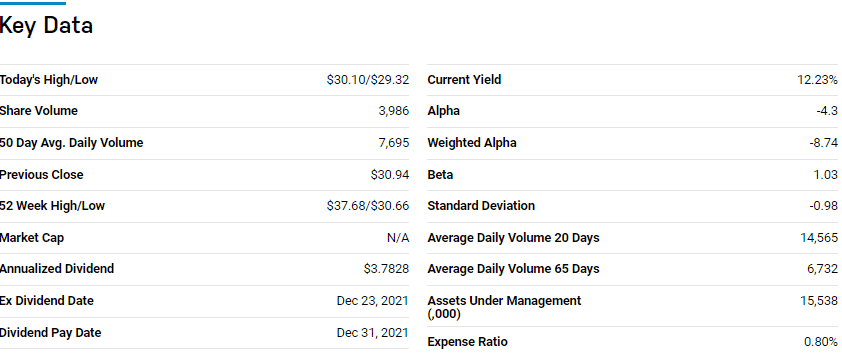
The FPA ETF has $15.7 million in assets under management, with a relatively higher expense ratio of 0.80%. Except for the past 12 months, the AlphaDex formula has ensured positive returns for this fund; 5-year returns of 27.44%, 3-year returns of 17.56%, 1-year returns of -7.39%.
Its weighting methodology provides for a well-balanced fund, and with an annual dividend yield of 2.92%, this fund is worth exploring if seeking South Korean exposure.
KraneShares MSCI Emerging Markets ex-China Index ETF (KEMX)
Price: $30.72
Expense ratio: 0.23%
Dividend yield: 1.55%
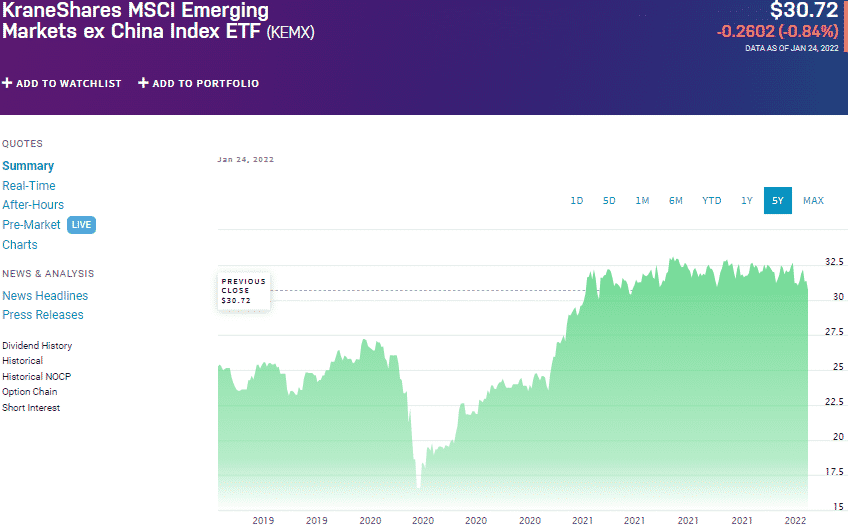
KEMX price chart
The KraneShares MSCI Emerging Markets ex-China Index ETF tracks the MSCI Emerging Markets ex-China Index, investing at least 80% in its underlying index and associated depository receipts, including ADRs.
The top three holdings of this fund are:
- Taiwan Semiconductor Manufacturing Co., Ltd. – 10.73%
- Samsung Electronics Co., Ltd. – 5.93%
- Infosys Limited Sponsored ADR – 2.40%
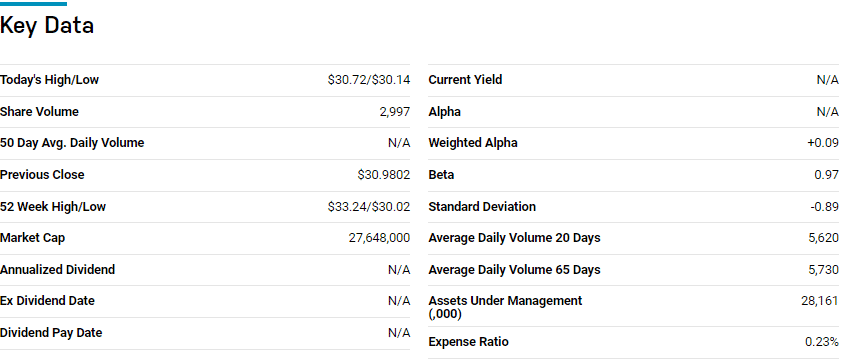
The KEMX ETF boasts $28.2 million in assets under management, with an expense ratio of 0.23%. Concentrating on emerging markets in the Asia-Pacific region, excluding China, this ETF has joined an elite group by posting positive returns in its first 12 months of trading, +0.88%.
First Trust BICK Index Fund (BICK)
Price: $29.89
Expense ratio: 0.64%
Dividend yield: 0.66%
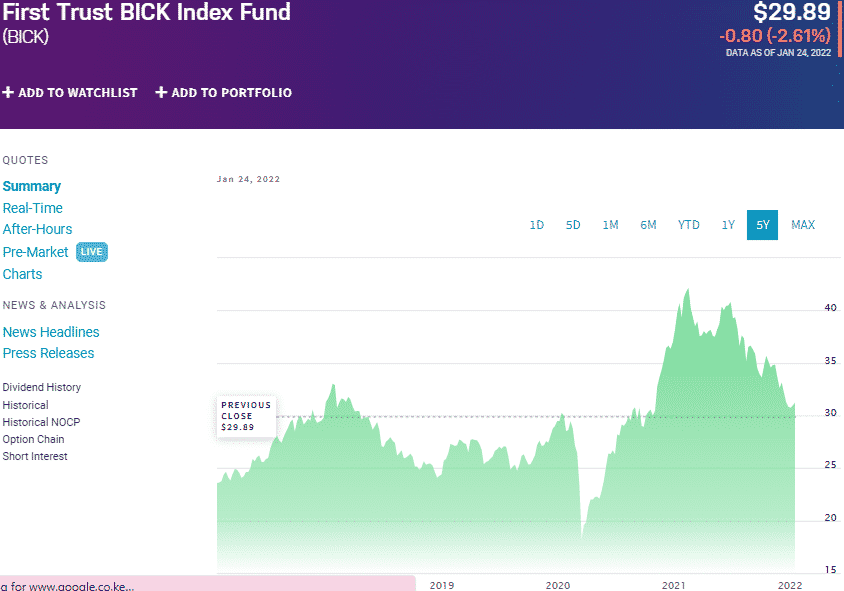
BICK price chart
The First Trust BICK Index Fund tracks the ISE BICKTM, investing at least 90% in its underlying index and associated depository receipts. It exposes investors to the emerging markets in the BRIC category but with a twist by swapping Russia with South Korea.
The top three holdings of this fund are:
- ICICI Bank Limited Sponsored ADR – 2.44%
- State Bank of India Sponsored GDR RegS – 2.33%
- MakeMyTrip Ltd. – 2.30%
The BICK ETF has $23.6 million in assets under management, with an expense ratio of 0.64%. Replacing Russia with South Korea diversifies this fund more than the BRICK-based fund, which has oil and gas skewness due to the former country. The result is a well-balanced fund to take advantage of globally leading emerging markets.
The historical performance also speaks to the resilience of this fund despite being in the negative in the last 12 months; 5-year returns of 43.65%, 3-year returns of 20.81%, 1-year returns of -22.35%.
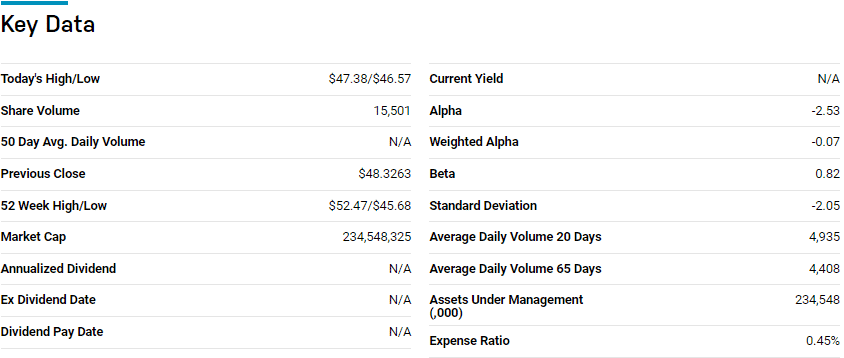
VictoryShares USAA MSCI Emerging Markets Value Momentum Fund (UEVM)
Price: $47.38
Expense ratio: 0.45%
Dividend yield: 3.86%
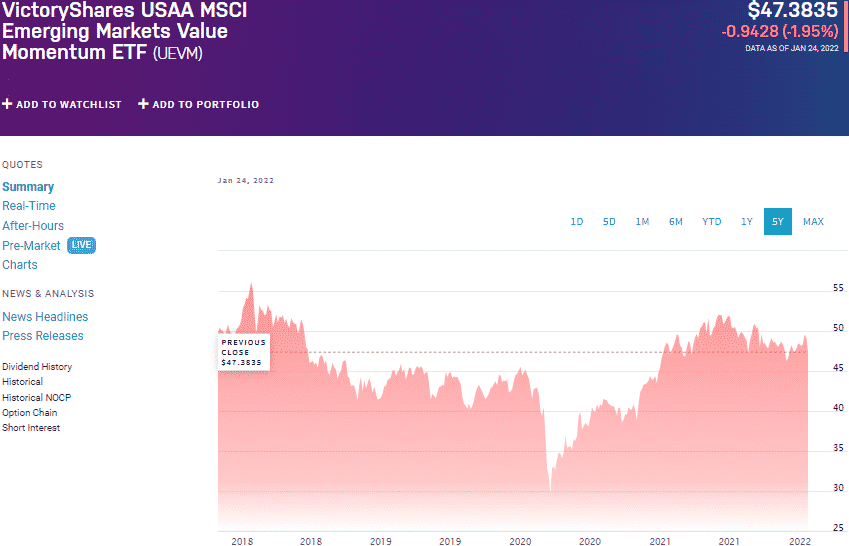
UEVM price chart
VictoryShares USAA MSCI Emerging Markets Value Momentum Fund tracks the MSCI Emerging Markets ex-China Index, investing at least 80% in its underlying index and associated depository receipts, including ADRs. It exposes investors to core emerging market equities offering both growth and value.
The top three holdings of this fund are:
- Synnex Technology International Corp. – 1.05%
- Taishin Financial Holdings Co., Ltd. – 1.02%
- Bank of China Limited Class H – 1.02%

The UEVM ETF has $242.6 million in assets under management, with an expense ratio of 0.45%. This fund promises momentum and value for a portfolio by representative sampling while picking holdings from the top 25% in each respective sector.
It then comes as no surprise that this fund has posted positive returns for its investors since inception; 3-year returns of 20.23% and 1-year returns of 3.46%. In addition, investors get to enjoy the regular income, with UEVM offering them an annual dividend yield of 3.86%.
Final thoughts
The coronavirus put a dump on the booming South Korean economy, but 2021 showed its ability to rebound at a tremendous pace. The Omicron variant has slowed down the record-breaking economic growth post-pandemic, but everything points to an acceleration once the situation is under control. The exchange-traded funds above expose investors to this economy and a chance for portfolio growth and value addition as it embarks on full economic resurgence.


Comments