
ETF full name: Vanguard Russell 2000 ETF (IWM)
Segment: US Small Cap Equity
ETF provider: Blackrock Financial Management
| IWM key details | ||
| Issuer | Blackrock Financial Management | |
| Dividend | 0.89% | |
| Inception date | 22nd May 2000 | |
| Expense ratio | 0.19% | |
| Average Daily $ Volume | $5.22 billion | |
| Investment objective | Replication Strategy | |
| Investment geography | US Small Cap Equity market | |
| Benchmark | MVIS US Small Cap Index | |
| Weighted Average Market Cap | $3.39 billion | |
| Net Assets under Management | $70.37 billion | |
| Number of holdings | 2027 | |
| Weighting methodology | Weighted average market cap | |
About the IWM ETF
For portfolio growth and wealth accumulation, small-cap equities are the best investment asset. While many people confuse small-cap stocks as beginner organizations, they are well-established organizations with healthy financials and market capitalization of between three hundred million and two billion dollars.
Large-cap stocks are the safer investment vehicles, but a look at the historical figures shows that small-cap stocks have been outperforming their larger counterparts. This performance is primarily attributable to small-cap stock prices having better legroom for growth.
The iShares Russell 2000 ETF is one of the most popular ways to gain exposure to the US small-cap equity market, either as a buy and hold strategy or for short-term volatility trading-daily average trading volume of $5.22 billion.
IWM Fact-set analytics insight
The iShares Russel 2000 ETF tracks the Russell 2000 index to replicate its performance as closely as possible, net of expenses and fees. IWM invests at least 80% of its total assets in the underlying holdings of its composite index or those with similar economic characteristics, with the remaining 20% invested in futures, swap deals, options, and cash and cash equivalents. As such, it exposes its investors to over two thousand domestic small-cap equities with the most growth potential.
The only border that the iShares Russell 2000 ETF has crossed is the northern border, including a few Canadian Small Cap Equities.
IWM performance analysis
A glance at the chart below shows the iShares Russell 2000 ETF has been a consistent performer. The world is recovering from the effects of the Corona pandemic presenting a world of opportunities that will allow small-cap ETFs to stretch their operations and grow, resulting in profitability.
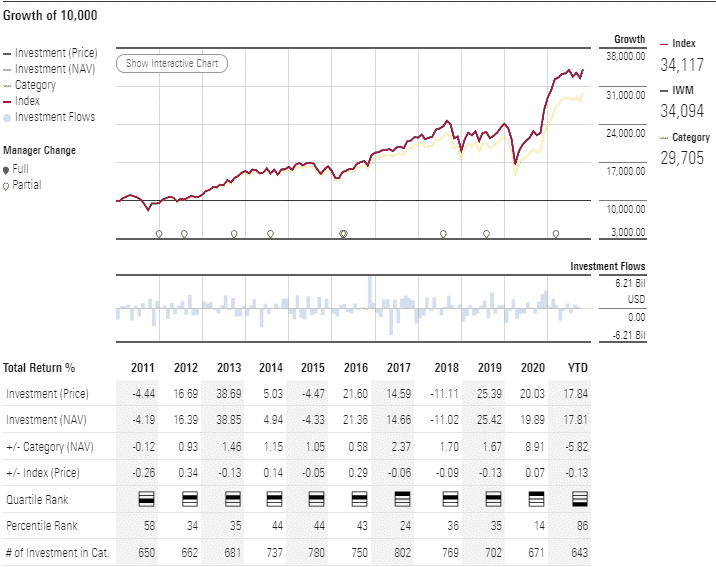
IWM ETF performance chart
With tentacles in organizations across the economic divide, IWM provides the diversification to hold its own when certain sectors are highly volatile. It is for this reason that this small-cap ETF is the mainstay of investors seeking portfolio growth.
A look at the historical performance in the last five years reveals that the IWM ETF outperforms its segment average and its category average; 5-year returns of 100.73%, 3-year returns of 63.26%, and pandemic year returns of 42.12%.
IWM ETF RATING |
|||||
| Resource | ETF DATABASE | ETF.com | MarketWatch.com | Morningstar.com | Money.usnews.com |
| IPO Rating | A+ | A/83 | Quantile 5 | **** | #18 in small blend |
| IPO ESG Rating | 4.86/10 | 4.86/10 | N/A | 28.56 out of 50 | 6.7/10 |
IWM key holdings
The IWM holding base borrows heavily from the bottom two-thirds of its composite index. Despite having representation from all the major economic sectors, this ETF is heavy on the Financial Sector, Healthcare Sector, and Information Technology Sector.
The top ten holdings of the IWM are as below.
| Ticker | Holding name | % of assets |
| AMC | AMC Entertainment Holdings, Inc. Class A | 0.70% |
| OVV | Ovintiv Inc. | 0.35% |
| ASAN | Asana, Inc. Class A | 0.32% |
| LSCC | Lattice Semiconductor Corporation | 0.30% |
| TTEK | Tetra Tech, Inc. | 0.29% |
| NTLA | Intellia Therapeutics, Inc. | 0.29% |
| CROX | Crocs, Inc. | 0.28% |
| SGMS | Scientific Games Corporation | 0.27% |
| BJ | BJ\’s Wholesale Club Holdings, Inc. | 0.26% |
| APPS | Digital Turbine, Inc. | 0.26% |
The IWM is not one for investors interested in global exposure. It does have cross border exposure but in very insignificant percentages:
- USA-99.66%
- Canada-0.34%
- UK-0.01%
However, investors have the best-diversified fund among the small-cap segment, with exposure to all the segments.
| Industry | IWM | Segment Benchmark |
| Financials | 21.42% | 22.61% |
| Healthcare | 18.71% | 13.83% |
| Technology | 14.89% | 14.85% |
| Industrials | 13.49% | 14.03% |
| Consumer cyclicals | 12.79% | 15.32% |
| Energy | 3.89% | 3.49% |
| Materials | 3.82% | 5.04% |
| Consumer non-cyclical | 3.12% | 3.89% |
| Utilities | 2.39% | 2.04% |
| Telecommunication Services | 1.16% | 0.63% |
Industry outlook
Most small-cap industries won’t be the next Tesla or Amazon. However, those that might be sometimes fly under the radar for long because most analysts don’t cover small-cap equities. With the 2021 year-to-date returns of 17.81% and both investors and analysts backing a resurgent economy post-pandemic to favor small-cap stocks more, the IWM has the diversification to weather any upcoming waves in 2022.
Couple this optimism with the unique feature of IWM to trade options; it presents a strong case to be among any investor’s portfolio if looking for growth and wealth accumulation.


Comments