
ETF full name: Vanguard US Dividend Appreciation ETF CAD-H
Segment: Large-cap blend (US Equity)
ETF provider: Vanguard
| VGH details | |
| Issuer | Vanguard |
| Dividend | $0.18 |
| Inception date | 2 August 2013 |
| Expense ratio | 0.30% |
| Management company | Vanguard Equity Index Group |
| Average 3-5 EPS | N/A |
| Average Annualized Return | 17% |
| Investment objective | Seeks to track the performance of the S&P US Dividend Growers Index (CAD-hedged) |
| Investment geography | North America |
| Benchmark | S&P US Dividend Growers Index (CAD-hedged) |
| Leveraged | N/A |
| Median market capitalization | $191.9 billion |
| ESG rating | N/A |
| Number of holdings | 268 |
| Weighting methodology | Weighted |
About the VGH ETF
The Vanguard US Dividend Appreciation ETF CAD-H inception was on 2 August 2013. The VGH fund trades on the Toronto Stock Exchange under the ticker symbol, VGH.
The fund aims to track stocks of US companies that have a record of increasing dividends over time, whose Index is hedged to the Canadian dollar. The fund benchmarks the S&P US Dividend Growers Index (CAD-hedged).
Vanguard Investments Canada Inc. manages the VGH fund.
VGH Fact-set analytics insight
The VGH ETF has a net expense ratio of 0.30%. The fund has a median market cap of $191.9 billion and total net assets of $413 million. Furthermore, the fund has a daily trade volume of 33,613 units. The VGH fund has a spread of 0.08%.
VGH performance analysis
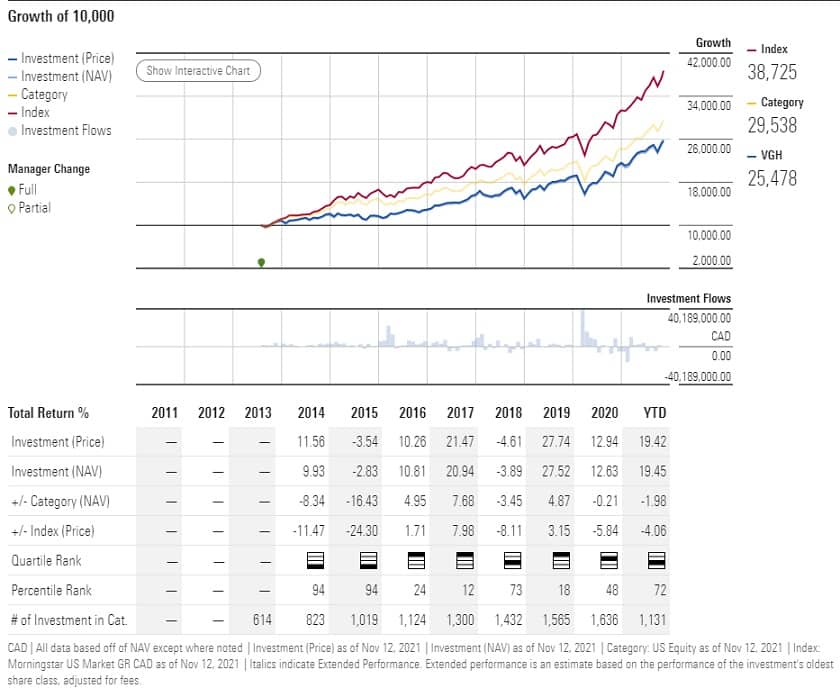
The projected growth of a $10,000 investment since inception came to $25,478. The VGH fund has no ESG ratings. The fund is currently trading at $56.22 per share.
VGH ETF RATING |
|||||
| Resource | ETF DATABASE | ETF.com | MarketWatch | Morningstar.com | Money.usnews.com |
| VGH Rating | N/A | N/A | N/A | *** | N/A |
| VGH ESG Rating | N/A | N/A | N/A | N/A | N/A |
VGH key holdings
The VGH fund has a total of 268 holdings. The fund invests in US equities, and therefore, its geographical distribution is in North America only.
The fund’s top sector breakdown is as follows:
- Industrials 22.1%
- Consumer discretionary 15.6%
- Financials 15.4%
- Health care 13.9%
- Technology 13.4%
Below is a list of the top ten holdings by company.
| Ticker | Holding name | % of assets |
| MSFT | Microsoft Corp. | 4.5 % |
| JPM | JPMorgan Chase & Co. | 3.9% |
| JNJ | Johnson & Johnson | 3.8% |
| UNH | UnitedHealth Group Inc. | 3.3% |
| V | Visa Inc. | 3.2% |
| HD | Home Depot Inc. | 3.1% |
| PG | Procter & Gamble Co. | 3.0% |
| CMCSA | Comcast Corp. | 2.3% |
| ABT | Abbott Laboratories | 1.9% |
| PEP | PepsiCo Inc. | 1.8% |
Industry outlook
The VGH fund had an average annual return of 10.4% over the past eight years. The stock is currently trading in the 70%-80% percentile range relative to its historical stock score levels.
The fund has an expense ratio of 0.30%, which is quite affordable compared to its peers in the category.
The fund is ideally suited for investors looking to benefit from long-term large-cap equities. Furthermore, the projected growth of the fund is showing significant returns, with a 254% return on investment since 2013.
Analysts have rated the fund a buy right now. However, investors should consider the risks related to the stock market carefully.


Comments