
Swing trading is a type of trading style that stands between day and long-term trading. It is a significant impulse movement that can be caught and used. The main advantage of the approach is an increase in the profit/risk ratio.
Swing traders usually go for a modest profit goal like 10-12% a month as they give less time on a trade and do it part-time in most cases. You may use different tools while trading swing as it is not bound to rules and limitations.
Do you want to learn how it works and the tools used while swing trading? Dive into this article and read it from the start till the end to know it all.
What is swing trading?
It is a way of making profits from small fluctuations in long-term swings. While trading swings, you tend to enter at the start of a new trend and move with it for a longer duration.
Unlike day trading, swing trading takes less time. You do not need to watch the entire trading session on the monitor. The average position retention period is about two weeks. But there are also situations when the stock grows in the trend direction for 4-6 months. In this case, the profit can be obtained the same as in day trading.
How does it work?
Swing traders vastly prefer technical analysis over fundamental analysis as fundamentals work better while scalping and day trading. Traders massively use technical indicators and different strategies like price action, harmonic pattern, and Elliott wave.
Working of swing trading involves:
- Analyzing the swing highs and lows depending on the market direction.
- Trying to catch a trade at the beginning of a new trend.
- Holding on to it till the desirable profits.
Swing traders generally hold their trades for days, weeks, or even months until they get their desired profit or think the trend will change. As swing trading needs you to hold your trades for long, it ultimately means you will have to look into the higher timeframe for your analysis, say daily or 4hr.
Uncovering the best swing trading indicators
Indicators are deployed on a daily or 4hr time frame to signal for buy or sell trading setups. Indicators used here assist swing traders in understanding if the market is moving up or down, whether the asset is volatile and has volume.
Moreover, some indicators further help in determining the entry and exit points. Apart from so many various indicators, we have three major kinds of swing trading indicators, and these are:
- Trend indicators
They show where the price is moving, either it is bullish or bearish.
- Momentum indicators
They determine how strong a trend is and the possibility of a trend reversal.
- Volume indicators
They show how many traders are actively buying and selling the asset at a given time.
Once we know the types of indicators, let us look into the top five best swing trading indicator tools for profit-making.
Tool 1. Moving average
It is one of the oldest technical indicators used by swing traders to measure an asset’s average price movement over a given time.
To differentiate between short, medium, and long-term MAs you can monitor the periods you are using. For example, to determine short-term trends, a trader can use anywhere between 5 and 50 periods. While for the medium, you can use 50-100MAs and 200 periods for the long term.
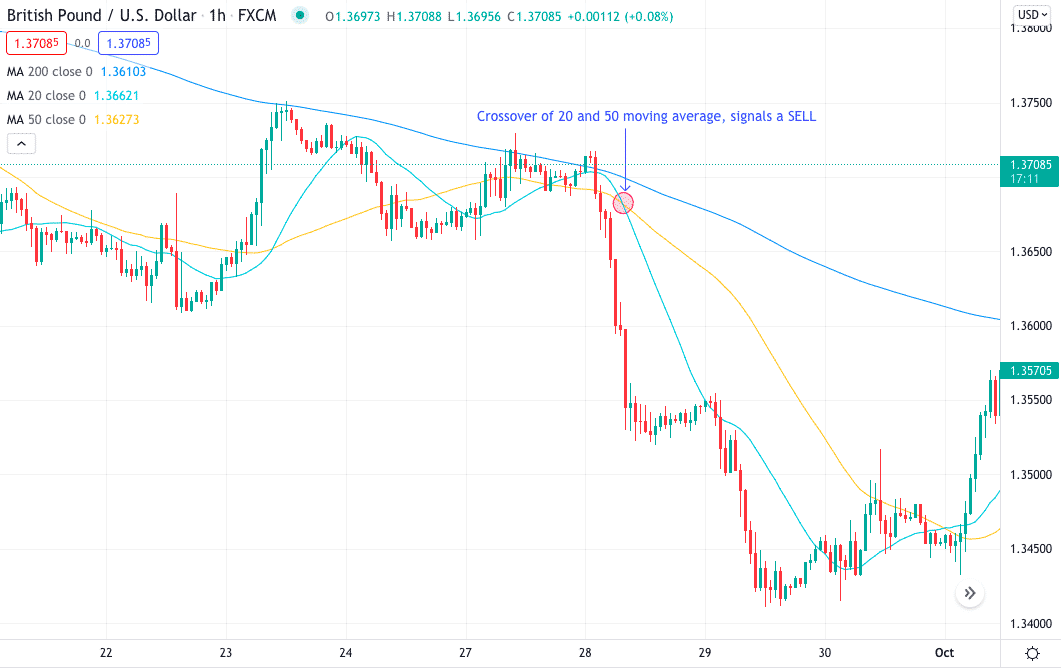
GBP/USD chart showing MA
You can use the 20 and 50-day MA and its crossover for signals. If the 20MA crosses the 50MA moving down, it’s a signal for a buy and vice versa. Using a 200-moving average shows the downtrend. This here signifies traders must trade their trade-in the direction of the trend.
Why is it useful for copy traders?
Traders usually use MAs for generating trading signals by crossover. 200 moving average is useful for analyzing the overall market trend.
Tool 2. RSI
It is a technical indicator intended to chart the current and historical strength or weakness of a stock or market based on the closing prices of a recent trading period.
RSI has a price line that moves between 0 to 100.
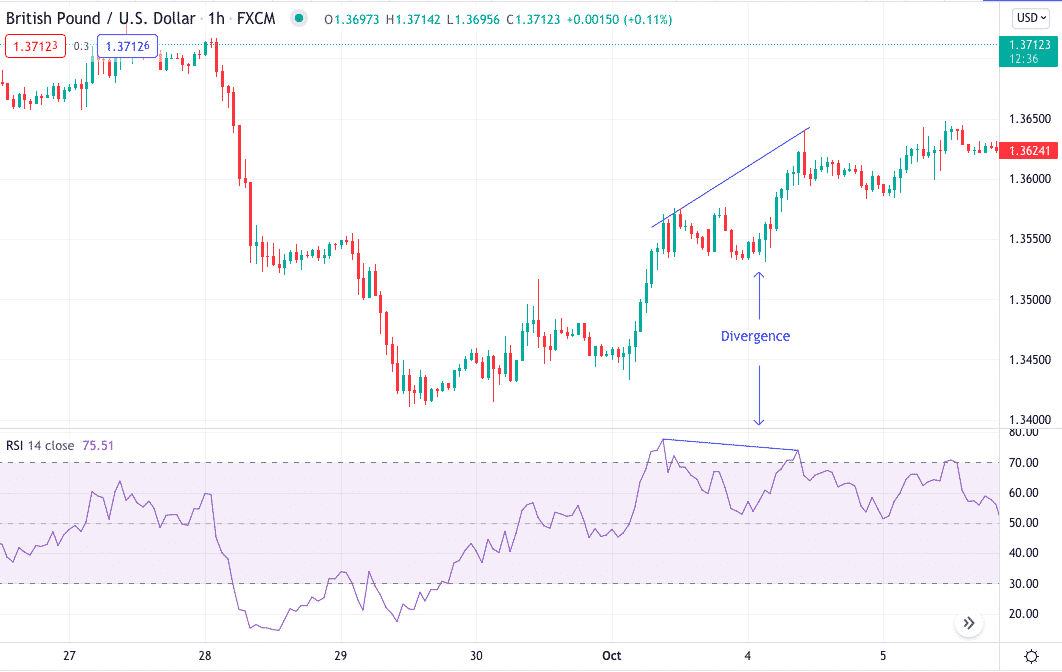
GBP/USD chart showing RSI
Why is it useful for copy traders?
You can use divergence on a higher time frame for better trade setups, say 1hr or 4hr — divergence when the price action and the RSI price line movement do not match.
Tool 3. MACD
It is a complex technical indicator that makes use of two MAs. It is calculated by subtracting the 26-period EMA from the 12-period EMA. However, the period variable can be edited according to the strategy and needs.
The major components that constitute a MACD are a MACD line, signal line, and histogram. All three components have their significance.
The MACD line measures the distance between two MAs. At the same time, the signal line can detect variations in price momentum and is considered the one that signals for a buy or a sell trade. The histogram represents the difference between the MACD line and the signal line.
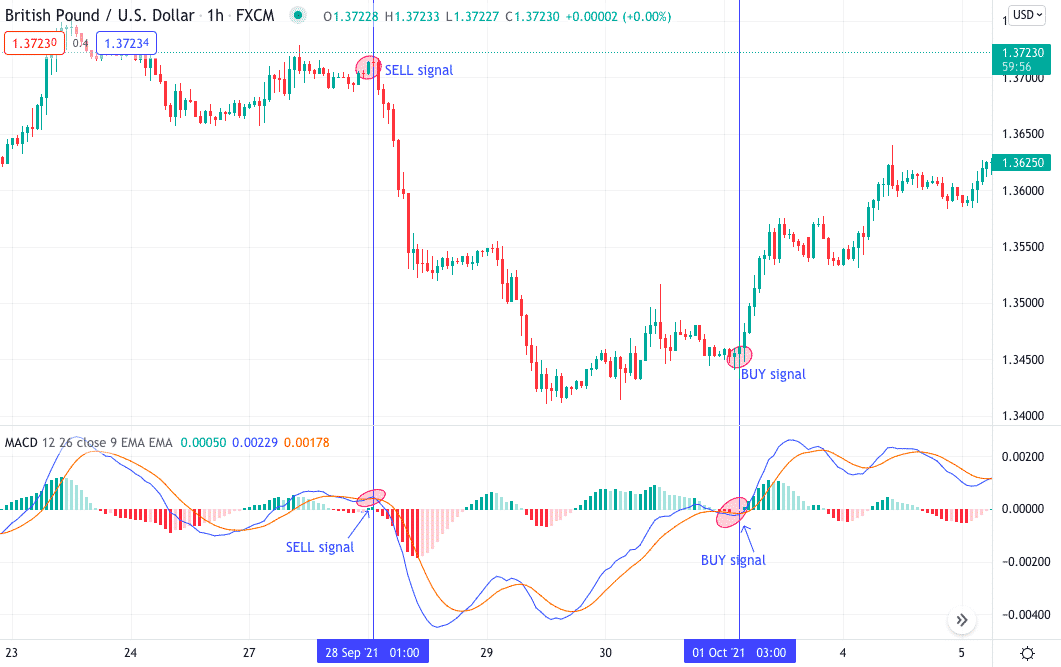
GBP/USD chart showing MACD
There is a buy signal when the MACD line crosses the signal line from above, moving down and vice-versa.
Why is it useful for copy traders?
MACD signals a buy or a sell trade by the crossover even before the price is formed on the chart.
Tool 4. Bollinger Band
Another momentum indicator ensures three lines – two standard deviations and a MA in between. Swing traders prefer this indicator because it quickly recognizes a trend, the overbought and oversold zones, and the volatility.
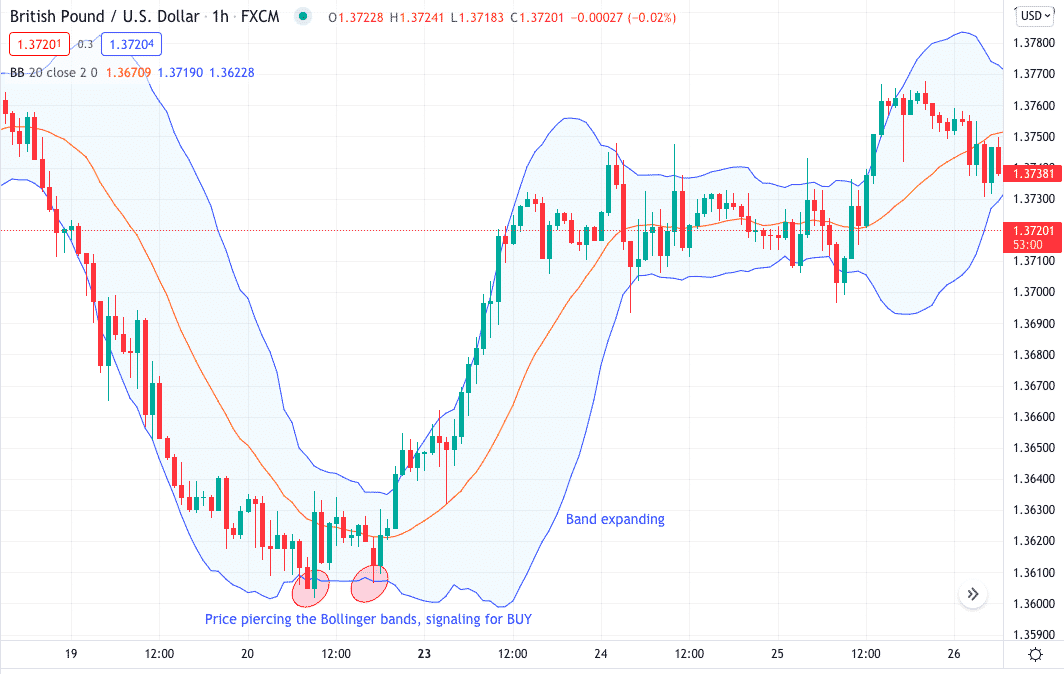
GBP/USD chart showing Bollinger Band
When the bands in price Peirce the upper or lower band at a high or low, you can take it as a signal for buy and sell. Here price was making a double bottom and also pierced the lower band signaling a buy trade setup.
Why is it useful for copy traders?
BB is a trading tool used to determine entry and exit points for a trade. The bands are often used to determine overbought and oversold conditions.
Tool 5. Volume
Many traders overlook this inbuilt indicator but let us inform you that this is by far a very critical indicator and must not be ignored, especially while swing trading.
The volume indicator determines how many traders are buying or selling an asset at a given point. Thus, the higher the volume, the stronger the trend.
When used while trading breakouts, the volume indicator shows high volume signing if all the other trader sentiments.
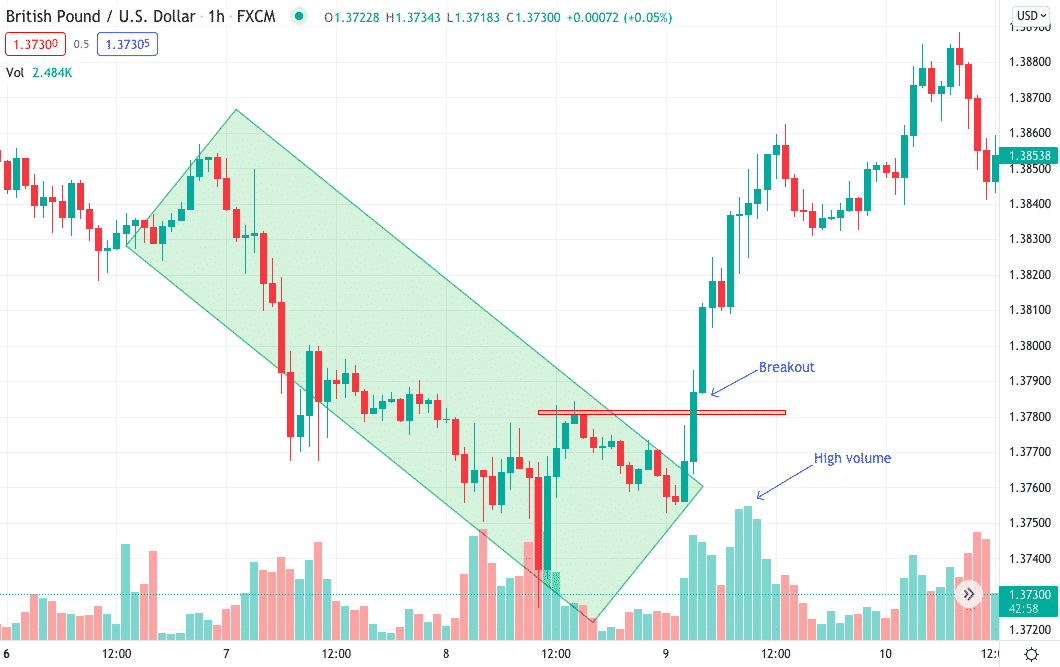
GBP/USD chart showing volume indicator
The price here broke the previous high and also the bearish channel. You can see the volume indicators show high buying pressure.
Why is it useful for copy traders?
The volume price trend indicator is used to determine the balance between a security’s demand and supply.
Pros and cons
| Pros | Cons |
| Easy to find the trend
Technical indicators, while trading swing helps determine the overall market trend. Price action traders struggle a bit here. |
Indicators do not always work
Technical indicators do not work all the time. Yes, they tell you the momentum, volume, trend, and other essential market characteristics but do not work well when it is choppy and less or highly volatile. |
| Less time in front of the screen
Swing traders do not need to sit in front of the screen all the time as they take the trade once and keep it running for long until good profit. |
Realize greater losses
If a trade while swing trading goes wrong, the trader has to bear greater losses as a trend can move in a specific direction for a long time. |
| It brings in less emotion
While using technical indicators, your emotions will not come in between your trading decisions. |
It realizes greater losses
Swing trading means holding your trade for long; any fundamental news and events can interpret your trade-in for this duration. |
Final thoughts
Swing trading takes less time but is challenging as it needs a lot of patience in holding the trade for a longer duration. Swing traders, if in loss, make more significant losses.
It is always better to use an excellent risk-reward strategy before entering the market. The indicators mentioned above work most of the time, but it is always better to have more confluence to get accurate trading setups.


Comments