
Gamma squeeze trading methods enable crypto investors to participate in the most potentially profitable trades. Crypto investors usually determine the squeeze or low volatile phases through this technique and identify the most potential trading positions through this technical indicator.
However, when seeking to use any technical indicator for successful crypto trading, knowing the elements and calculation procedure is mandatory to use that tool most effectively. In this article, we will enlighten the Gamma squeeze EMA concept.
Later we list the top five tips to use the concept to determine the most potential trading positions.
What is the Gamma squeeze EMA plot indicator?
The indicator is useful for determining the market context according to participants’ actions. This indicator uses fifteen different EMA lines to obtain the market context. Six of them are blue, six are red, and the rest three have different colors: green, deep green, and black.
The EMA line with the highest value is black, and the EMA line with the lowest is blue. This indicator uses the MA crossover to obtain the market info. Crypto investors use the readings or appearances of these EMA lines to determine squeeze or momentum in any direction.
Top five tips for using the Gamma squeeze EMA plot indicator
The following section will list the top five tips for effectively using the Gamma squeeze EMA plot indicator. Let’s check it out.
Tip 1. When seeking bullish movement
When seeking to open a buy position using the Gamma squeeze EMA plot, you may be interested in executing trades near support levels. Observe the EMA lines as the blue lines surpass the red lines on the upside, declaring the price facing a buy pressure or buyers domination at the asset price.
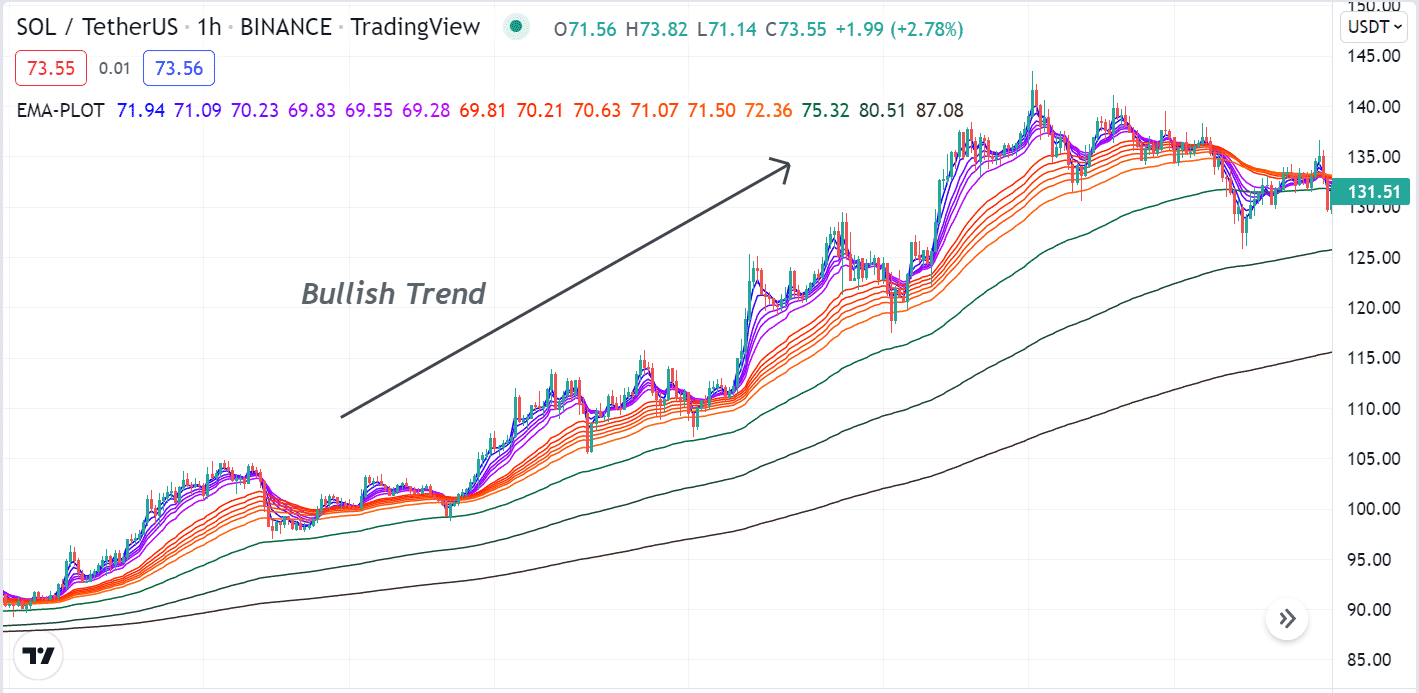
Bullish condition
How to determine?
It happens as the EMA crossover concept suggests a bullish pressure when any exponential moving averages of lower value cross above any EMA line of the higher value, indicating the positive force on any certain asset price.
How to avoid mistakes?
When using this concept to execute a buy trade, don’t enter until the blue EMA lines completely reach above the red EMA lines. Moreover, checking on fundamental facts and conducting a multi-time frame analysis will help make more efficient trading positions. Match the price above the black line to confirm that the overall price remains in an uptrend.
Tip 2. When seeking bearish movement
Crypto investors usually open sell positions by confirming the downtrend. When seeking to open a sell position using the Gamma squeeze EMA plot, the readings will be exactly opposite to the bullish one. In this case, the blue EMA lines will decline below the red EMA lines declaring the price is facing a declining pressure or the sellers are in control of the market.
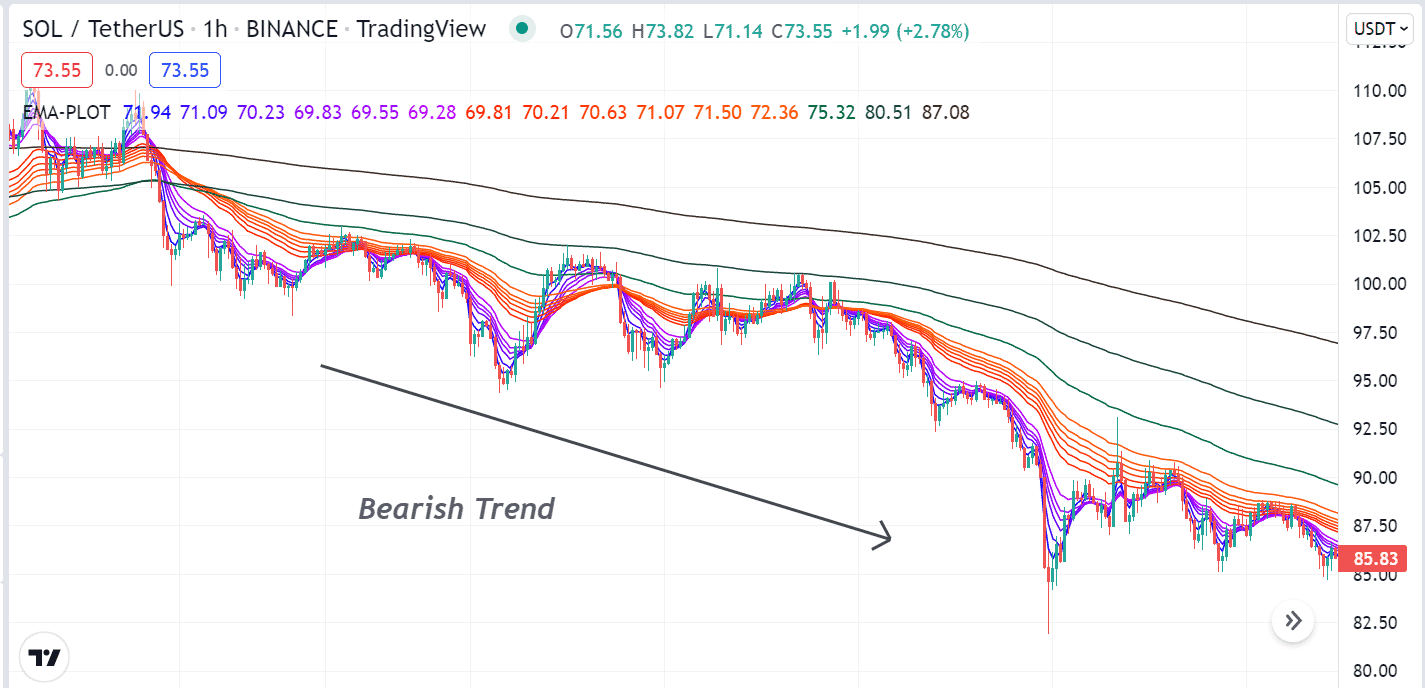
Bearish condition
How to determine?
It happens as this indicator uses the EMA crossover concept. Any EMA line with smaller value declines below any EMA line with a larger value occurs as declining pressure increases.
How to avoid mistakes?
When using this concept to determine the most potent sell position, wait to execute a trade at least when all six EMA lines reach below all the red EMA lines. Moreover, confirm the price remains on an overall downtrend as all these occur below the black EMA or the EMA line with the greater value.
Tip 3. Detecting sideways market
The Gamma indicator helps crypto investors to determine the sideways or consolidating price movements. When these scenarios appear, it declares that the price is consolidating or remains sideways. In this case, all EMA lines of the trading indicator will get nearby, and frequent crossover between these signal lines will keep occurring.
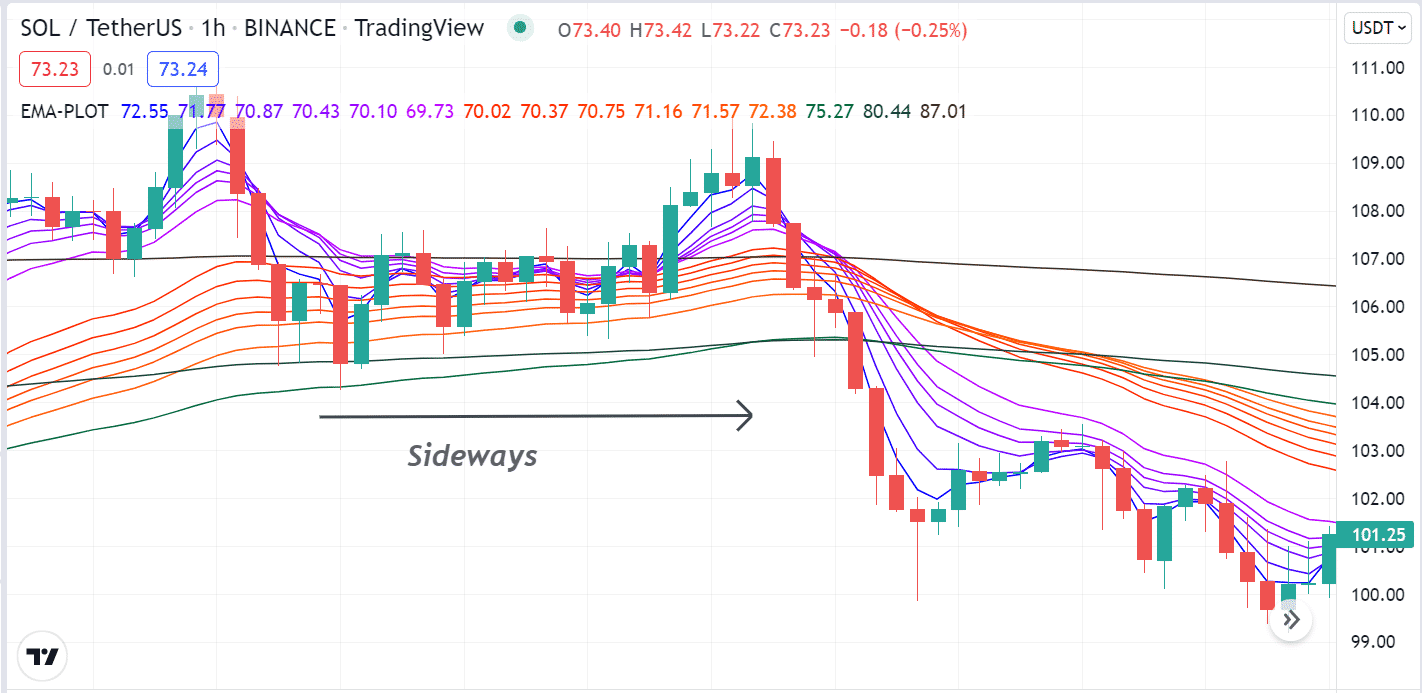
Sideways
How to determine?
EMA lines of different values frequently cross over as the volume decreases or smaller movement keeps occurring, and EMA lines of higher and lower get closer.
How to avoid mistakes?
Commonly, financial assets such as bonds, stocks, or currencies become low-volatile before significant news releases. Financial investors usually detect the consolidating phases to avoid smaller movements as it doesn’t enable making considerable profits. Moreover, crypto investors seek squeeze price movements to participate in trendy movements.
Tip 4. Detecting breakouts by combining ADX indicator
Smart traders seek to execute trades when a breakout occurs as it enables performing trades with low risks and maximizing profits. If you have a basic understanding of support resistance, you can detect breakouts using the Gamma squeeze indicator and combine it with the ADX indicator readings.
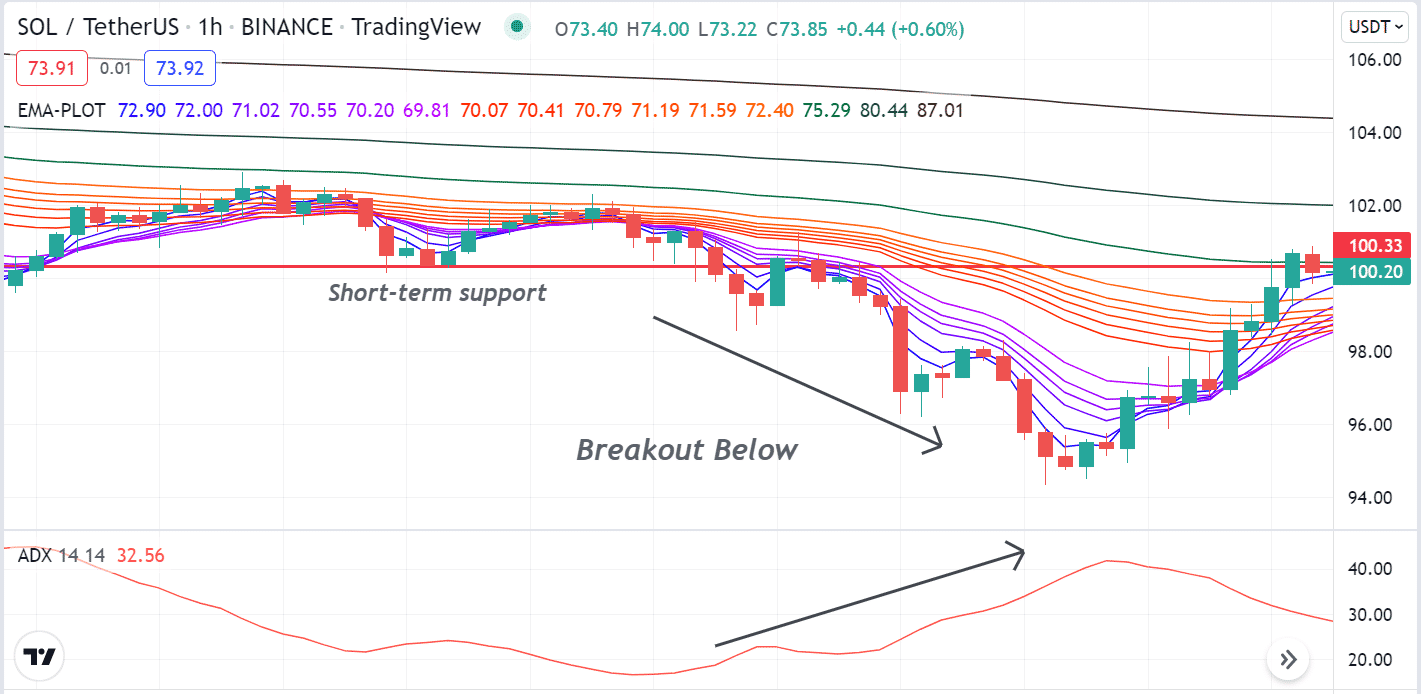
Breakout
How to determine?
It happens as the price may start declining below a particular support level. Meanwhile, the Gamma squeeze indicator declares a declining pressure on the asset price, and the ADX indicator confirms the trend has sufficient strength as the reading reaches above 20. Combining all these, investors can determine precious trading positions.
How to avoid mistakes?
Combine both indicators readings carefully. Moreover, if you use a short-term time frame, it is better to conduct a multi-time frame analysis or check upper time frame charts to confirm the direction.
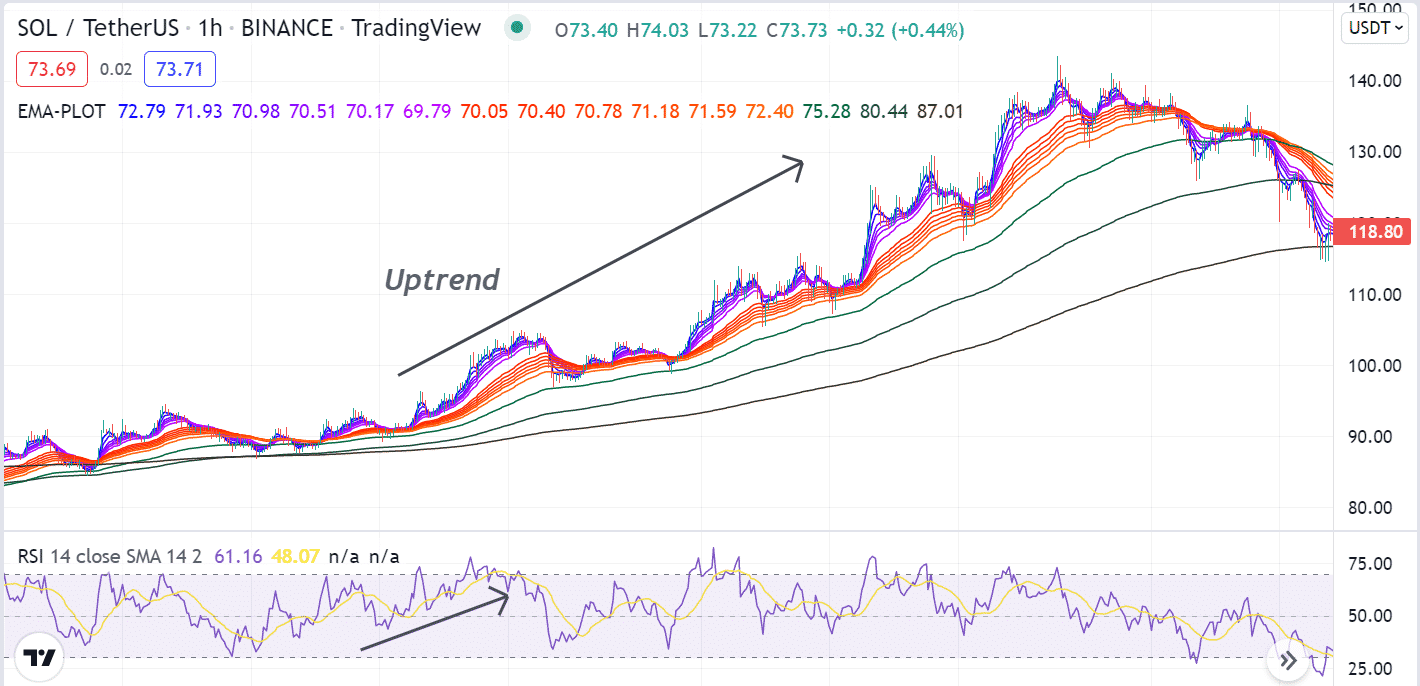
Tip 5. Combining the RSI indicator with Gamma
You can execute precious trades by combining the Gamma indicator readings with the RSI indicator. For example, the indicator may suggest a bullish price pressure. Another popular momentum indicator, the RSI, confirms the direction as the dynamic line remains at or above the central (50) level and heads on the upside. Combining all these readings, you can open a precious buy position.
Combining both indicators
How to determine?
Both indicators suggest a particular direction helps execute precious trading positions.
How to avoid mistakes?
When using this concept to execute trades, we suggest checking both indicators readings carefully before opening any positions. Moreover, match the current trend direction of your order from the upper timeframe charts before entering the market.
Final thought
Finally, this article introduces you to a most potent technical indicator for crypto trading that is usually based on the EMA crossover concept. You can customize the colors of the EMA lines according to your desire. Moreover, you can combine many other indicator readings with the indicator to create sustainable trading strategies for crypto trading, including the parabolic SAR, MACD, Bollinger Bands, etc.


Comments