Despite last-minute selling at the close of 2022, the SPY still managed to close December with a positive monthly change, +4.5%, the best December month in the last decade. As a result, it made 70 consecutive highs, almost breaking the 77-calendar year high recorded in 1954.
Would the SPY ride off its record year fumes and news of outpacing the Dow Jones and Nasdaq to start the year strongly, or would the Santa Claus Rally result in a negative opening to the year?
Monday’s opening gap up of 0.6% to have the SPY start its trading at $477.99 was a sign of continuing bullish run to many, given the previous week’s opening gap up and weekly bullish run, riding the Santa Claus Rally wave to finish the week in the green, and the years at +27%. This opening price coincided with the yearly resistance, and bullish investors were opening this would support kickstart 2022’s earning season.
Unfortunately for the SPY, the holiday season is over, with the end of the Santa rally. Economic data shows that inflation is still running unchecked, and economic resurgence post-pandemic has slowed down. The exponential spread of the Omicron Covid-19 variant has not helped with cyclical sectors in the travel, hotel, and entertainment industries suffering the most.
In addition, despite record November and December new jobs data, the labor market is struggling with resignation with people not ready to return to work with increased covid cases, 4.5 million concessions.
Top gainers of the current week
Energy sector
After the OPEC meeting, the energy sector opened the years on the mark to be the biggest gainer. The conversation revolved around boosting supply to bring a market balance with production expected to 400k by February. The result was a positive weekly change of +6.59%.
Financial Services Sector
Most organizations are in a new financial year, resulting in finances. As a result, investor funds went to the financial services sector to fund the next phase of economic resurgence for such firms resulting in a weekly positive change of +2.59%.
Consumer Staples Sector
The consumer staples sector took advantage of new year inflows to finish the week in the green, +0.43%.
Losers of the current week
Sectors that dragged the SPY to its worst trading week in a while were;
Healthcare sector at — 3.04%
Information Technology sector at — 3.26%
Real Estate sector at — 4.51%
Despite all the jitters surrounding the Omicron coronavirus and slowing down economic resurgence, the first week of trading saw investors pump money into more hawkish sectors, resulting in a slump in the inflation-hedged sectors.
Below is a performance chart of the S&P 500 over the week and its component sectors.
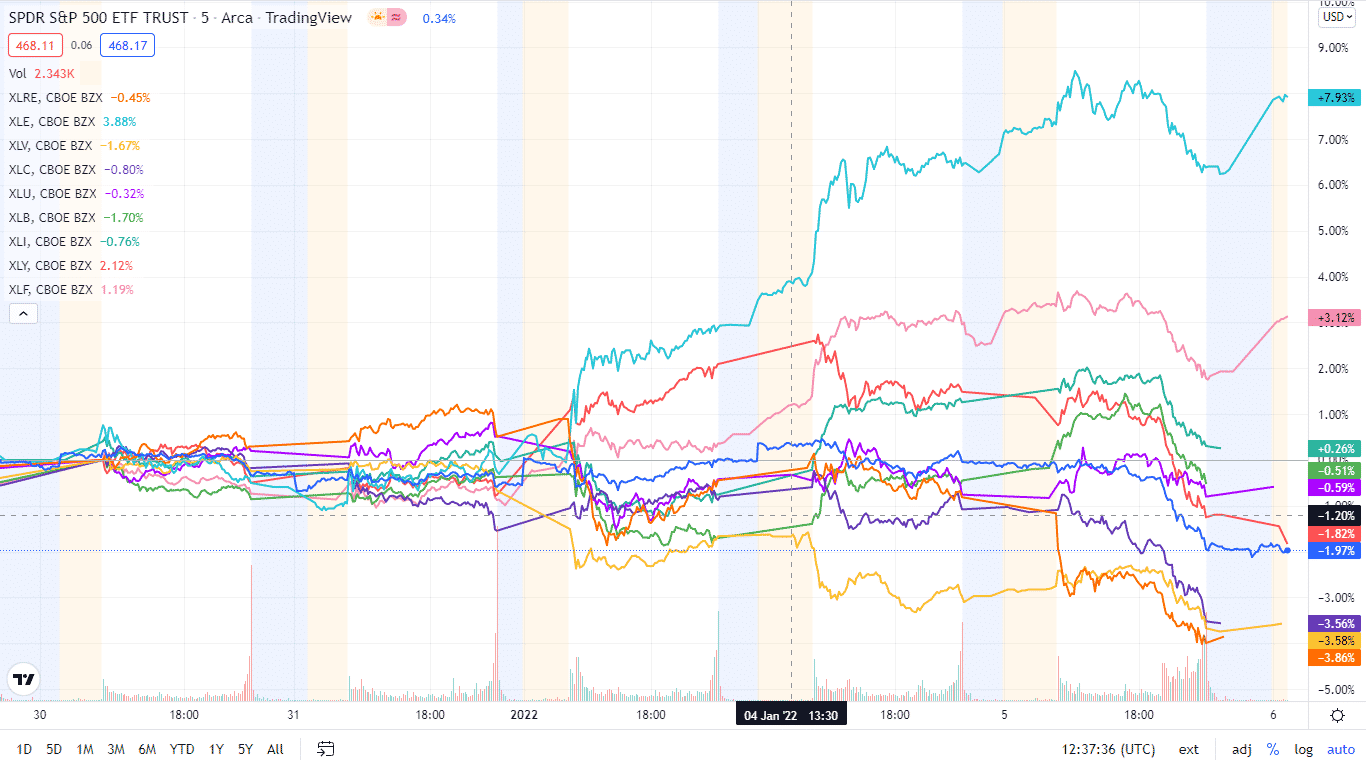
The S&P 500 individual sectors’ weekly chart
The following breakdown shows how the S&P 500 ended the week, using their corresponding ETFs. The week started on a sour note, with most sectors being in the red.
The S&P 500 individual sector, weekly performance breakdown |
|||
| 1. | Energy | XLE | +6.59% with the accompanying energy select sector ETF |
| 2. | Financial Services | XLF | +2.59% with the accompanying financial select sector ETF |
| 3. | Consumer Staples | XLP | +0.43% with the accompanying consumer staples select sector ETF |
| 4. | Industrial | XLI | +0.22% with the accompanying industrial select sector ETF |
| 5. | Materials | XLB | -0.17% with the accompanying materials select sector ETF |
| 6. | Consumer Discretionary | XLY | -0.63% with the accompanying consumer discretionary select sector ETF |
| 7. | Utilities | XLU | -1.3% with the accompanying utilities select sector ETF |
| 8. | Communication Services | XLC | -2.71% with the accompanying communication services select sector ETF |
| 9. | Healthcare | XLV | -3.04% with the accompanying healthcare select sector ETF |
| 10. | Information Technology | XLK | -3.26% with the accompanying information technology select sector ETF |
| 11. | Real Estate | XLRE | -4.51% with the accompanying real estate select sector ETF |


Comments