
ETF full name: SPDR Dow Jones Industrial Average ETF
Segment: Large-cap US equities
ETF provider: SPDR State Street Global Advisors
| DIA key details | |
| Issuer | State Street SPDR |
| Dividend | 1.94% |
| Inception date | January 14, 1998 |
| Expense ratio | 0.16% |
| Management company | State Street Global Advisors |
| Investment objective | Provide investment results that correspond to the Dow Jones Industrial Average (DJIA) |
| Investment geography | US |
| Benchmark | Dow Jones Industrial Average |
| Leveraged | No |
| Weighted average market cap | $368.93 billion |
| MSCI ESG rating | 5.82 out of 10 |
| Number of holdings | 30 |
| Weighting methodology | Price-weighted |
About the ETF
The SPDR Dow Jones Industrial Average ETF was launched on January 14, 1998. It tracks the Dow Jones Industrial Average (DJIA) — one of the oldest continuing stock indices in the US. Its expense ratio is pretty low at just 0.16%.
The ETF has an impressive dividend yield of 1.94%. The top 10 constituent stocks with the highest dividend yields are referred to as the “Dogs of the Dow.”
Many professionals believe that the DIA ETF is not a good choice for investors seeking broad-based exposure to large-cap US stocks. That’s because it includes only 30 stocks compared to 500 stocks in the S&P 500 index. Another reason is that it’s weighted by stock price rather than market capitalization.
DIA FactSet analytics insight
The DJIA is a price-weighted index consisting of 30 blue-chip US stocks. A committee selects the index constituents, and the S&P Dow Jones Indices maintains it. If you want exposure to the Dow, as DJIA is popularly known, the DIA is the biggest and most popular ETF out there.
Despite its price-weighing methodology and small size, the DJIA is one of the three indices used as a barometer of the US stock market.
The DIA ETF gives you exposure to Information Technology — 21.23%, Industrials — 17.68%, Healthcare — 16.83%, Financials — 15.35%, and Consumer Discretionary — 13.42% sectors. In contrast, the S&P 500 has a higher exposure to IT — 26.7% and much lower exposure to the Industrials — 8.9% sector.
Since the DIA tracks a price-weighted index, the higher-priced stocks have more significant influence than the lower-priced stocks irrespective of their market capitalization.
DIA annual performance analysis
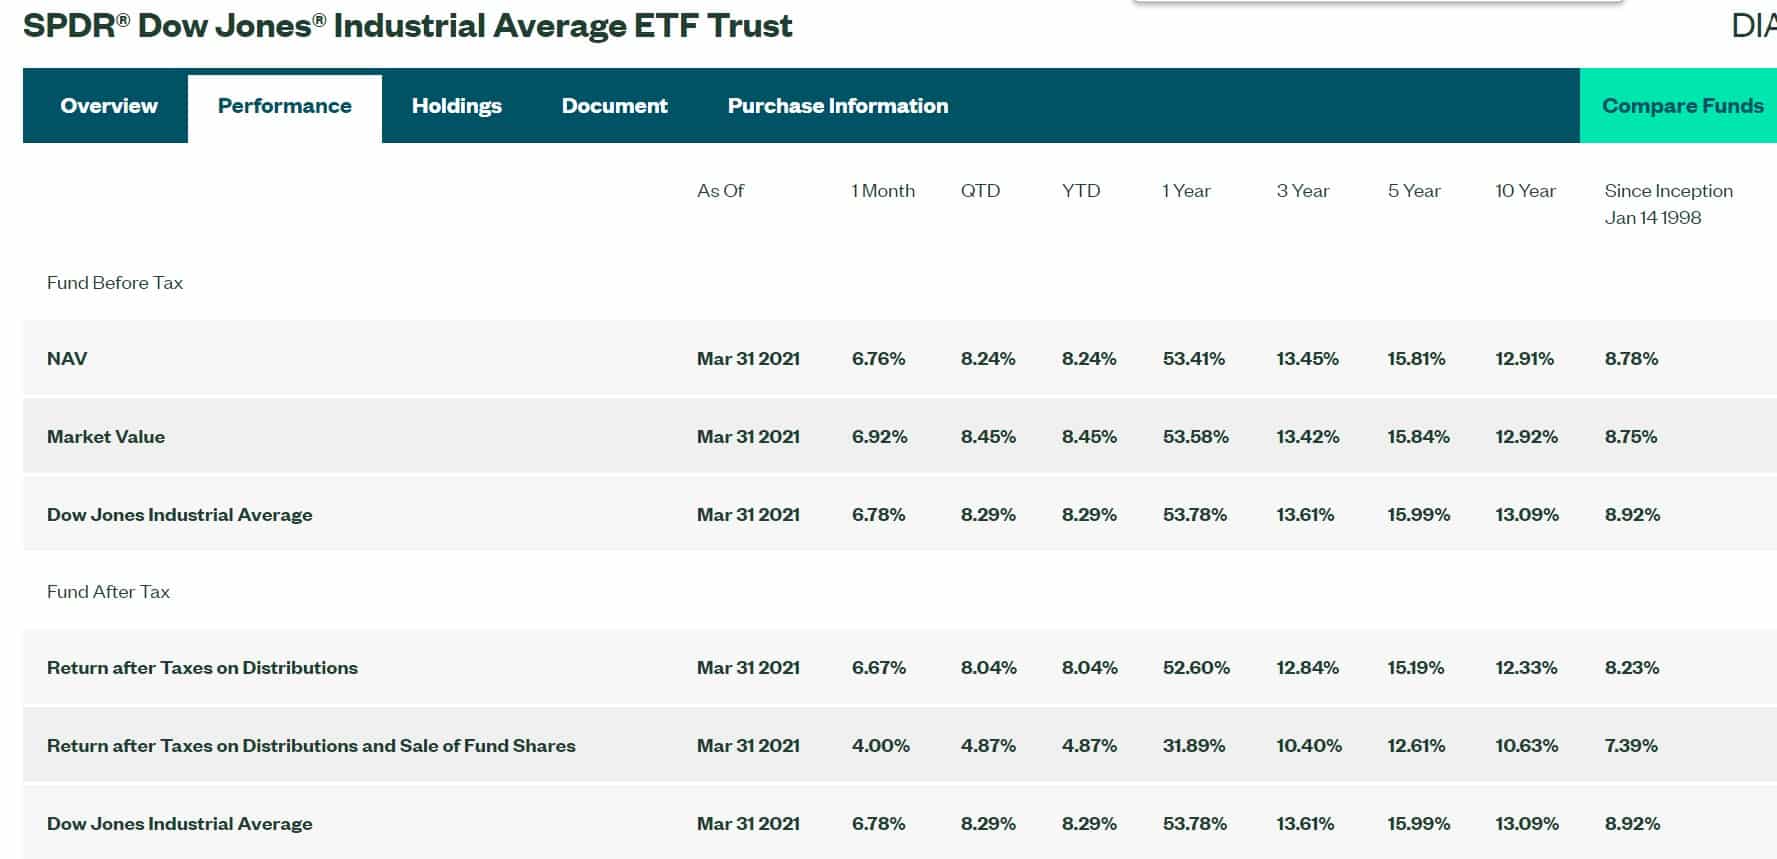
The average performance of the DIA ETF over the last three years was 13.45%. Besides, it has delivered an impressive 53.41% return over the previous year. But that’s expected considering the markets were near the bottom in March 2020 due to the COVID-19 pandemic. Uncertainty over the US Presidential election was another reason for the ETF’s heightened volatility.
The ETF includes blue-chip stocks such as IBM, Caterpillar, GE, and ExxonMobil that have been around for decades and have long been profitable companies. They are unlikely to go bankrupt anytime soon unless there is a catastrophic economic event. So the DIA is one of the safest ETFs out there, but most of its constituents are not high growth stocks.
|
SPDR Dow Jones Industrial Average ETF (DIA) |
||||
| Resource | ETF DATABASE | ETF.com | MarketWatch | Morningstar.com |
| DIA | A+ | A 72 | 5 | 5 |
| QQQ | A- | A 59 | 5 | 5 |
| MSCI ESG Rating | – | 5.82/10 | – | – |
DIA key holdings
The DIA ETF consists of 30 mega-cap and large-cap stocks. It’s not as diversified as ETFs tracking the S&P 500 or Nasdaq 100 indices.
The biggest constituent is not Apple or Amazon, but UnitedHealth Group — 7.34%. Goldman Sachs constitutes 6.47% of the ETF, followed by Home Depot Inc. at 6.25%. Microsoft is the largest tech company on the list at 4.99%. Occupying the fifth spot is the aerospace giant Boeing Company — 4.86%.
There are the ten most extensive holdings of the DIA ETF as of April 2021.
| N | Name | Weight in percents |
| 1. | UnitedHealth Group Incorporated | 7.34% |
| 2. | Goldman Sachs Group Inc. | 6.47% |
| 3. | Home Depot Inc. | 6.25% |
| 4. | Microsoft Corporation | 4.99% |
| 5. | Boeing Company | 4.86% |
| 6. | Amgen Inc. | 4.85% |
| 7. | McDonald’s Corporation | 4.50% |
| 8. | Caterpillar Inc. | 4.50% |
| 9. | Salesforce.com inc. | 4.46% |
| 10. | Honeywell International Inc. | 4.46% |
Industry outlook
The US economy has started showing clear signs of recovery, boosting the near-term growth prospects. In March, the US non-farm payrolls rose by 916,000 jobs, beating analysts’ projection of 647,000.
An economic recovery would drive earnings growth for businesses across the board, including the DIA constituents.


Comments