
ETF full name: iShares Russell 2000 ETF
Segment: Small-cap US growth equities
ETF provider: BlackRock Fund Advisors
| IWM key details | |
| Issuer | Blackrock, Inc. |
| Dividend | 0.91% |
| Inception date | May 22, 2000 |
| Expense ratio | 0.19% |
| Management company | BlackRock Fund Advisors |
| Investment objective | Track the investment results of the Russell 2000 Index |
| Investment geography | US |
| Benchmark | Russell 2000 Index |
| Leveraged | No |
| Weighted average market cap | $3.92 billion |
| MSCI ESG rating | 4.25 out of 10 |
| Number of holdings | 2,057 |
| Weighting methodology | Market-cap-weighted |
About the ETF
BlackRock, Inc. launched the iShares Russell 2000 ETF (IWM) on May 22, 2000. It tracks the Russell 2000 index, which consists of publicly-listed US small-cap and micro-cap companies. Companies that rank from 1,001st to 3,000th most extensive stocks by market capitalization are part of the index.
Its expense ratio is just 0.19%. This single ETF gives you exposure to more than 2,000 small-cap US stocks. IWM is the most traded ETF tracking the Russell 2000 index.
IWM FactSet analytics insight
The ETF tracks the Russell 2000 Index, which is market-cap weighted. Small-cap stocks with a higher market cap will have a more significant influence on the index. But its constituent stocks are not selected by a committee. Securities in the index are picked based on a formula that considers the market capitalization and the current index membership.
It covers almost every sector of the American economy. And no single stock has a disproportionately high weightage in the index. Even the biggest constituent has a weightage of only 0.61%.
The healthcare sector has the highest weightage — 18.45% in the index. Many of the healthcare companies on the list are engaged in drug discovery and development. It is followed by industrials — 16.12% and financials — 16.05%. Consumer discretionary — 14.82% and information technology — 12.93% are the fourth and fifth largest sectors.
IWM annual performance analysis
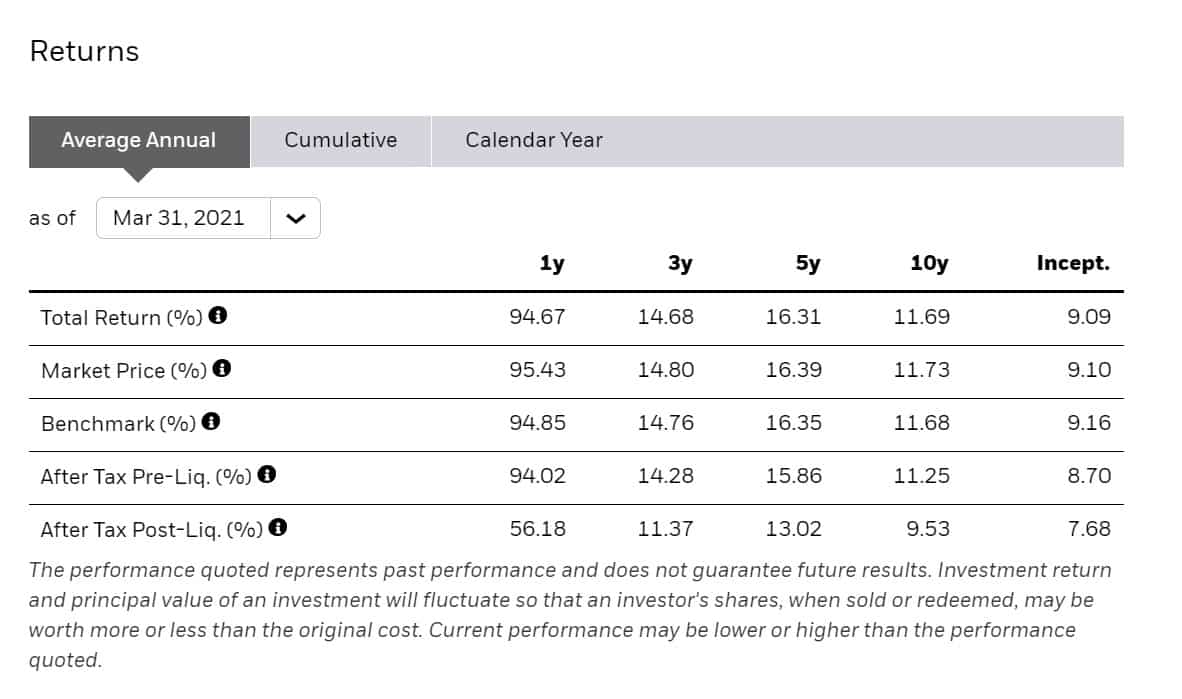
The IWM ETF has delivered a staggering 94.67% return over the last year. It shouldn’t come as a surprise, given the markets were near the bottom in March 2020. Three-year and five-year returns are also impressive, especially considering the ETF fell 11.02% in the calendar year 2018.
It’s one of the most diversified ETFs out there. But since it includes small-cap and micro-cap stocks, it has a relatively higher volatility than the market. The ETF’s beta over the last three years was 1.31. For the uninitiated, a beta above 1 reflects higher volatility than the market.
Small-cap ETFs have been in the spotlight recently due to expectations of a robust economic recovery. The US Federal Reserve has issued strong guidance for the next couple of years.
|
iShares Russell 2000 ETF (IWM) |
||||
| Resource | ETF DATABASE | ETF.com | MarketWatch | Morningstar.com |
| IWM | A+ | A 87 | 5 | 4 |
| MSCI ESG Rating | – | 4.25/10 | – | – |
IWM key holdings
If you look at the IWM constituent stocks sector-wise, the healthcare sector has the highest weightage. But the stock with the highest weightage is from the consumer discretionary sector. Casino entertainment provider caesars entertainment is the largest holding, accounting for 0.61% of the index.
It’s followed by Penn National Gaming — 0.56% and Plug Power Inc. — 0.42%. Novavax Inc., which has developed a COVID vaccine, constitutes 0.42% of the ETF. Occupying the fifth spot is Darling Ingredients Inc. — 0.39%.
These are the ten most significant holdings in the IWM exchange-traded fund.
| Ticker | Name | Sector | Asset class | Market value | % of assets |
| CZR | Caesar Entertainment Inc. | Consumer discretionary | Equity | $411,216,639.24 | 0.61% |
| PENN | Penn National Gaming Inc. | Consumer discretionary | Equity | $381,299,516.64 | 0.56% |
| PLUG | Plug Power Inc. | Industrial | Equity | $288,032,822.12 | 0.42% |
| NVAX | Novavax Inc. | Health care | Equity | $286,311,962.46 | 0.42% |
| DAR | Darling Ingredients Inc. | Consumer staples | Equity | $264,524,665.12 | 0.39% |
| LAD | Lithia Motors Inc. Class A | Consumer discretionary | Equity | $240,551,519.52 | 0.35% |
| BLDR | Builders Firstsource Inc. | Industrials | Equity | $234,580,891.84 | 0.35% |
| RH | RH | Consumer discretionary | Equity | $225,177,157.32 | 0.33% |
| DECK | Deckers Outdoor Corp. | Consumer discretionary | Equity | $233,651,530.80 | 0.33% |
| CHDN | Churchill Downs Inc. | Consumer discretionary | Equity | $197,486,6000.85 | 0.29% |
Industry outlook
After the lows of March 2020, the small-cap stocks have come roaring back. They delivered impressive returns in 2020. Substantial gains have continued through early 2021. According to Investment U, it signals that investors are confident about a big bull run in 2021.


Comments