It has been quite the year for the SPY and its investors, setting the stage nicely for drama as 2021 gets into the rearview mirror.
Would the SPY embrace the holidays’ spirits and ride a final bullish run to record the best year since 2013-+32.4%?
Monday’s opening gap up of 0.2% to have the SPY start its trading at $471.52 was a sign of continuing bullish run to many, given the previous week’s opening gap up and weekly bullish run to have it finish in the green. Coincidentally, the opening price rested against the SPY’s new yearly high set at the close of last week of $471.52.
The US Food and Drug administration authority granted a license to a second firm for the home remedy for Covid-19, which might be attributable to the tampering of jitter by investors regarding the Omicron variant. As a result, the markets started where they had left off to push upwards, fueled by the better-than-expected economic news on Tuesday and Friday of the previous week.
In addition, rule 7.2 of the New York Stock Exchange would reappear after a decade to have traders able to trade on a Saturday since it coincides with the closure of the yearly accounting period. With these factors cracking the whip, the S&P 500 would go on to ride the tails of the Christmas mood and post a positive week, +1.59%, a new high at $475.95, and second-best trading year since 2013, +29.13%.
Top gainers of the current week
Real Estate sector
Despite the Santa Claus rally, investors are aware of the rising inflation resulting in inflows to more defensive investment options. The real estate sector is full of inflation-hedge investment options and took full advantage to close the last week of 2021 with a +3.51% change.
Utilities sector
Inflation is no longer a tale of economists and central bank officials. The Christmas spending just let everyone knows how dire the situation is, resulting in more inflows into yet another defensive option, utilities, resulting in a positive weekly change to the tune of +2.31%.
Materials sector
The baseline economic outlook stepping into 2022 is reasonably good. However, continued FED tapering and looming interest rate hikes will result in market volatility before things stabilize, which will call for cautious investment. Despite continued supply bottlenecks, caution had investment flow into the materials sector, another defensive option, closing the week with a +2.10% weekly change.
Below is a performance chart of the S&P 500 over the week and its component sectors.
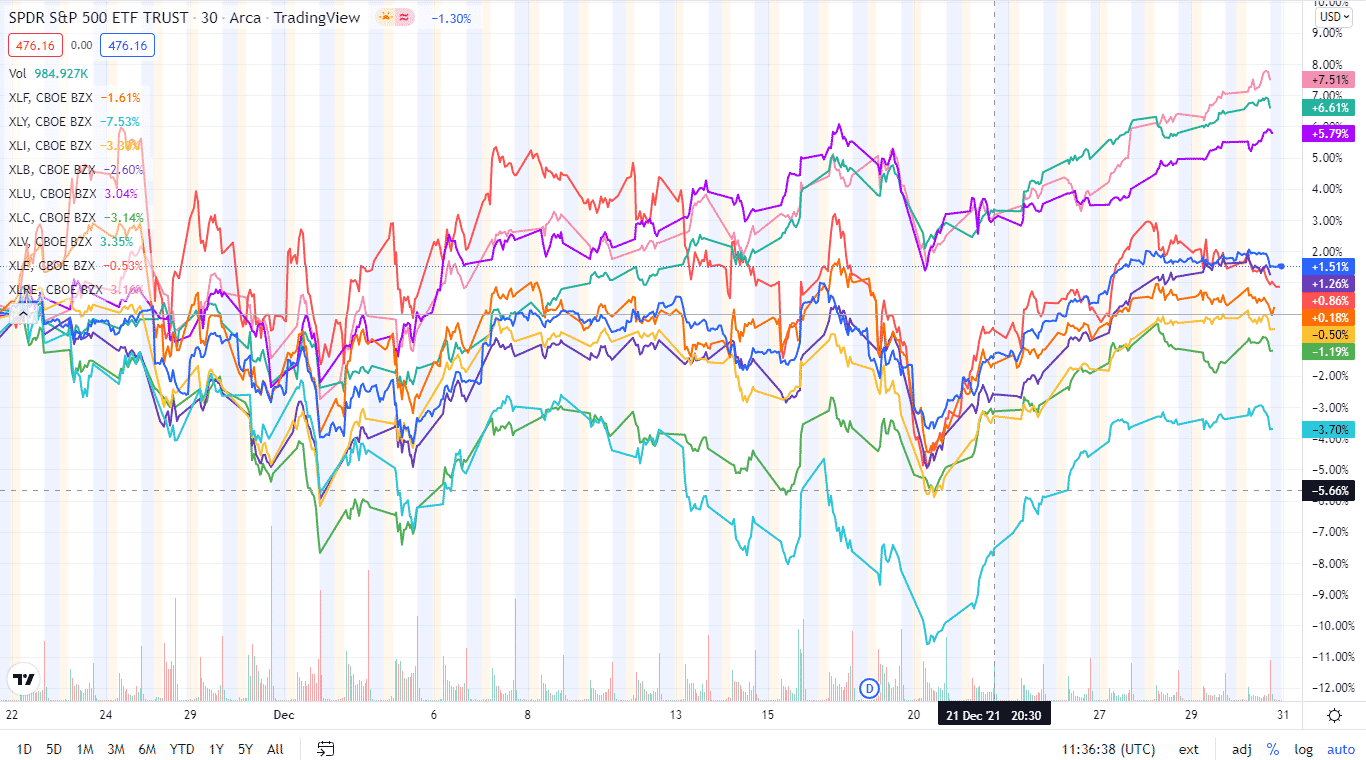
The S&P 500 individual sectors’ weekly chart
The following breakdown shows how the S&P 500 ended the week, using their corresponding ETFs. All finished in the green to ensure that the SPY made yet another record; the most all-time highs in 26 years with its 70th record high.
The S&P 500 individual sector, weekly performance breakdown |
|||
| 1. | Real Estate | XLRE | +3.51% with the accompanying real estate select sector ETF |
| 2. | Utilities | XLU | +2.31% with the accompanying utilities select sector ETF |
| 3. | Materials | XLB | +2.10% with the accompanying materials select sector ETF |
| 4. | Consumer Staples | XLP | +1.76% with the accompanying consumer staples select sector ETF |
| 5. | Healthcare | XLV | +1.53% with the accompanying healthcare select sector ETF |
| 6. | Industrial | XLI | +1.34% with the accompanying industrial select sector ETF |
| 7. | Information Technology | XLK | +0.96% with the accompanying information technology select sector ETF |
| 8. | Energy | XLE | +0.79% with the accompanying energy select sector ETF |
| 9. | Consumer Discretionary | XLY | +0.71% with the accompanying consumer discretionary select sector ETF |
| 10. | Financial Services | XLF | +0.68% with the accompanying financial select sector ETF |
| 11. | Communication Services | XLC | +0.43% with the accompanying communication services select sector ETF |









Comments