April is done and dusted and has been the worst month for the equity markets since the start of the pandemic.
Would the Q1 earnings report by a third of the S&P bring an end month bullish rally, or would it result in a new bottom?
An opening price of $423.63 did not spell good news for investors with the bullish sentiment, given it was a 0.6% gap down from where prices had tumbled last week before the market closure. Bears drove the markets on the backdrop of this gap down to the $420.27 price level, proving to be the week’s pivot point.
This level acted as a launchpad for the bulls to take on the bears, pushing prices upwards of $428.60, a pivotal level for March. Still, it would prove a formidable resistance level sparking another bearish run that saw prices flirt with the 2022 support level of $416.33. This seesaw would continue for the rest of the week to have the SPY post another sideways week with a bearish inclination.
Despite Musk’s deal buoying tech equities in an otherwise largely gloomy week, investors’ bullish optimism seems to be balanced by the low-risk appetite on the backdrop of macro factors, top of the list being rising inflation, the war in Ukraine, and rising interest rates. Inflation and the FEDs accelerated rate hikes, with the May hike looking more and more in the 50-basis points region, continue to take center stage. The result of these jitters was another week on the ropes resulting in a -2.07% slide.
Top gainers of the current week
Information Technology
Musk’s influence seems to continue growing with his deal for Twitter rousing the tech sector from doldrums to end the week in the green, +3.00%.
Energy Sector
The continued shortage of fuel globally and the resulting price increase saw the energy sector attracts inflows for the week to end it on a positive with a +1.21% weekly change.
Materials Sector
Leading indicators show that the economy is still expanding, buoying the materials sector despite everything going on. Couple this with the evolving consumer expenditure patterns that have seen demand shift to in-person goods and services, and it’s no wonder that this sector experienced significant inflows to have it finish the week with a +1.17% change.
Losers of the current week
Utilities Sector at — 1.12%
Financial Services Sector at — 1.23%
Consumer Discretionary Sector at — 2.10%
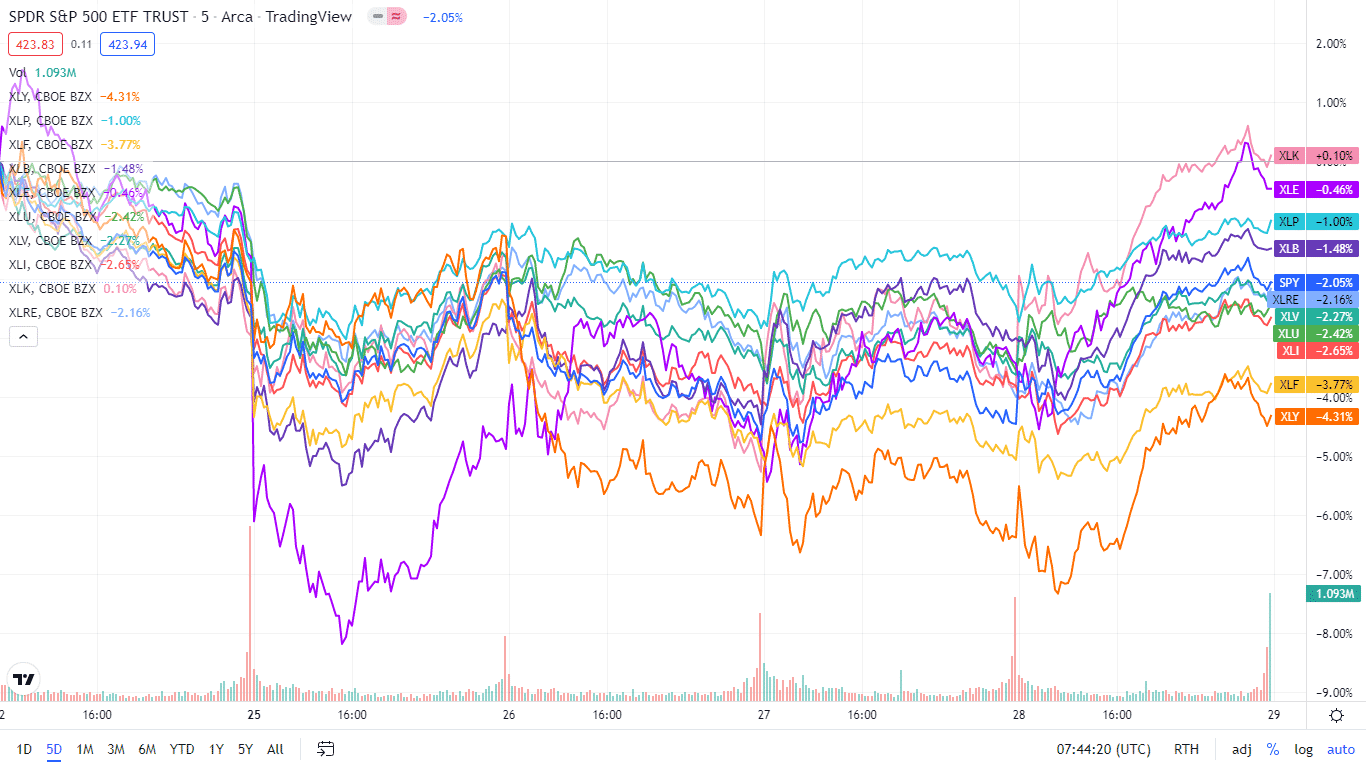
The continued investor jitters, rising inflation, and rising commodity prices continue to hit pockets leaving very little disposable income, and the worst-hit sectors for the week were as above. Below is a performance chart of the SP 500 over the week and its component sectors.

The S&P 500 individual sectors’ weekly chart
The following breakdown shows how the S&P 500 ended the week, using their corresponding ETFs. Another week of beating saw most of these sectors finish the week in the red.
The S&P 500 individual sector, weekly performance breakdown |
|||
| 1. | Information Technology | XLK | +3.00% with the accompanying information technology select sector ETF |
| 2. | Energy | XLE | +1.21% with the accompanying energy select sector ETF |
| 3. | Materials | XLB | +1.17% with the accompanying materials select sector ETF |
| 4. | Consumer Staples | XLP | +0.60% with the accompanying consumer staples select sector ETF |
| 5. | Healthcare | XLV | -0.03% with the accompanying healthcare select sector ETF |
| 6. | Communication Services | XLC | -0.54% with the accompanying communication services select sector ETF |
| 7. | Industrial | XLI | -0.72% with the accompanying industrial select sector ETF |
| 8. | Real Estate | XLRE | -0.80% with the accompanying real estate select sector ETF |
| 9. | Utilities | XLU | -1.12% with the accompanying utilities select sector ETF |
| 10. | Financial Services | XLF | -1.23% with the accompanying financial select sector ETF |
| 11. | Consumer Discretionary | XLY | -2.10% with the accompanying consumer discretionary select sector ETF |


Comments