Investing in the financial market can give you the taste of financial freedom. Once you master the affecting factors, you don’t need to spend time like regular eight hours desk jobs. However, it requires strong knowledge, experience, and practice. If you learn to trade and can sync technical and fundamental analysis together, you can become rich by trading very soon.
Several fundamental and technical factors affect the price of assets in the financial marketplace. The key points you need to know about fundamental analysis can make your trading more manageable and more profitable. A new participant in the financial market without understanding these facts trades like a blind trader. So they end up losing money as a consequence.
This article includes the importance of fundamental analysis and the vital fundamental facts of the financial market. So you can make your trading decisions more workable and catch the best trades with good profitability.
Why fundamental direction is important
Fundamental direction is such an essential fact for the financial market. The macroeconomic, socioeconomic events have a considerable impact on the price fluctuation of financial assets such as currencies, bonds, stocks, etc. Once you find out the fundamental direction of any financial asset, you can sync that with the technical outlook of that particular asset and make lots of potentially profitable trades.
-
Central banks impact
Central banks are the most significant participants in the currency market, and they are also the producers of banknotes and coins. They make decisions to keep their economy stable by observing the market conditions. The government and the central bank have more resources for any financial asset than any individuals or even financial institutes.
Some decisions such as interest rate, foreign policies, government purchase, etc. put an impact on the prices of currencies, bonds, stocks, and so on financial products that last for months or years.
-
Technical analysis impact
On the other hand, technical analysis mainly analyzes the asset with historical data, patterns, and mathematical terms that price movement follows. Individual traders and small firms are not like the prominent financial institutes that invest for a more extended period. Most of them make short- or medium-term trades and hold the asset for months, weeks, days, hours, or even minutes.
So when they know the price direction or identify the trend of price movement, they can easily catch the profitable trading positions by syncing that fundamental data with technical analysis and continuously increasing their capital.
Sync technical analysis on fundamental direction
Identify trend using four fundamental indicators
The four most common fundamental indicators for identifying the price direction of any currency are the interest rate, inflation, GDP, and employment data.
-
Interest rate
Central banks change the interest rate to have a stable economy. When the central bank raises the interest rate, it has a significant impact on spending. The increasing interest rate means the consumers and businesses cut their spending, and the stock prices may fall.
Cutting down or lower interest rates means more borrowing and spending, so earnings and stock prices may rise. It is a massively related term with borrowing and spending behavior. Smart traders always follow the interest rate.
-
Inflation
It is an economic term that is related to the prices of goods and services. Increasing inflation causes the goods and services cost to rise, and more inflation means weaker currency as demand falls. When the inflation rate is in order, the currency and economy remain stable and demandable. The ideal inflation rate is around two percent or below.
-
GDP
GDP stands for Gross Domestic Product. It refers to the total finishing goods and services inside the border that happens in a particular period. Increasing GDP data means a stable and potential economic condition and the opposite for the declining GDP data.
-
Employment data
It is another vital fundamental indicator to understand the economic condition. When the unemployment rate is 4-5% or below, it is tolerable by many. Full or increasing employment means a productive, progressive or potential economy.
The central bank and authorities release these data periodically. You follow the economic calendar to observe these data to identify the fundamental direction of an economy.
Understand Hawkish and Dovish tone
A hawkish or dovish tone comes from the policymakers. Both use the interest rate to get their goal. Hawkish tones focus on controlling inflation, meanwhile dovish tone focuses on job creation and promotes economic growth. When you hear a hawkish tone, consider tightening their policy and raising the interest rates. So the dovish tone means discouraging increasing the interest rate.
Geopolitics
It is an important fact that affects currency prices and other financial assets. For a better understanding, look at the weekly chart of GBP/USD.
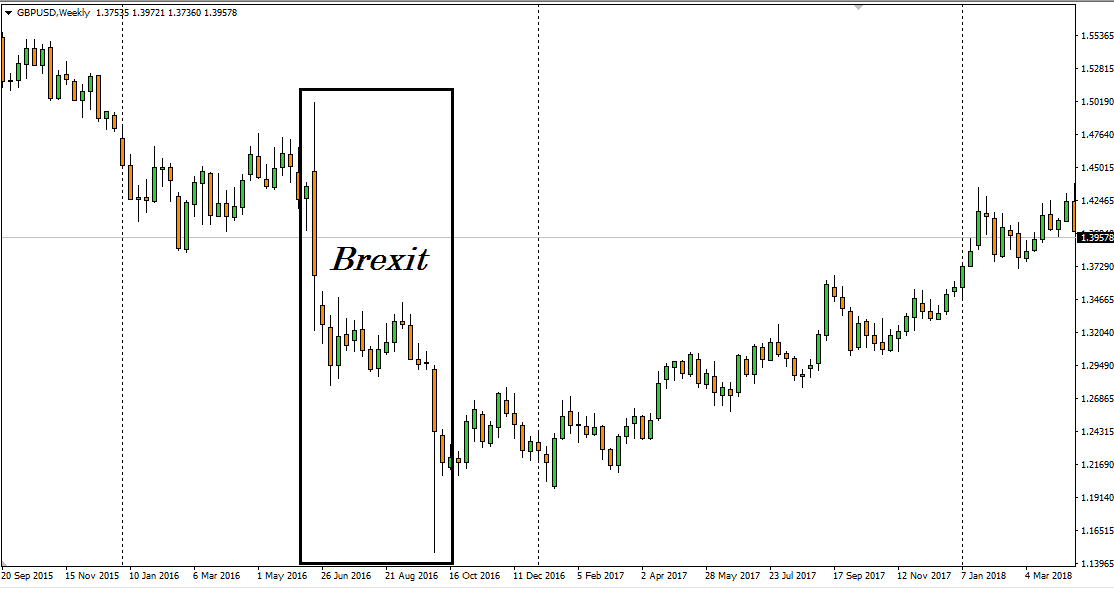
GBP/USD chart
The chart above shows a downward movement of 3200+ pips that just occurred for the Brexit decision from the UK back in 2016. So keep your eyes and ears open to get the opportunity to make money from this type of geopolitical event.
Another example you can follow bombing is when the middle east raises fear and tension, so commodities such as gold and oil price increase.
Economic uncertainty
Any economic uncertainty can come up. So we need to understand the impact by analyzing the data and behavior of price movement. Look at the weekly chart of gold below.
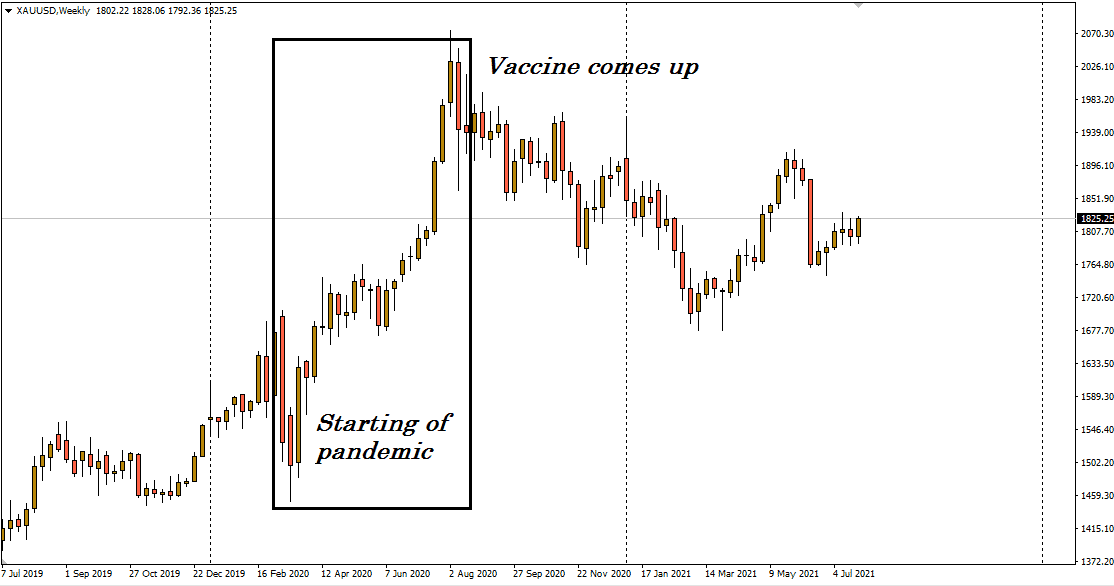
XAU/USD chart
When the Covid-19 pandemic came up in March 2020, the gold price started to make a sharp upward movement from near $1460-$2060 per ounce. That nearly $600 per ounce raise in a few months!
Pandemic comes up, putting the economy at risk of uncertainty with the lockdown and health crisis. Then again falls and comes downward with the invention of a vaccine for the coronavirus. That’s the uncertainty impact. So investors started to put their money on precious metals as a safe asset.
Final thoughts
Finally, you know the primary fundamental factors that impact the prices of financial assets. Therefore, focus on trades that match the fundamental direction. To master syncing the fundamental direction, you have to build a trading strategy using technical analysis.
For example, if the Eurozone economy is well based on fundamental analysis, focus on only buying trades according to your trading strategy.


Comments